Projected Memory Usage view
|
This view displays memory utilization metrics on the selected cluster. | |||||||||
|
Projected Storage Usage view
|
This view displays storage utilization metrics on the selected cluster. | |||||||
|
Projected Storage IOPs Usage view
|
This view displays storage Input/Output Operations Per Second (IOPs) utilization metrics on the selected cluster. | |||||
|
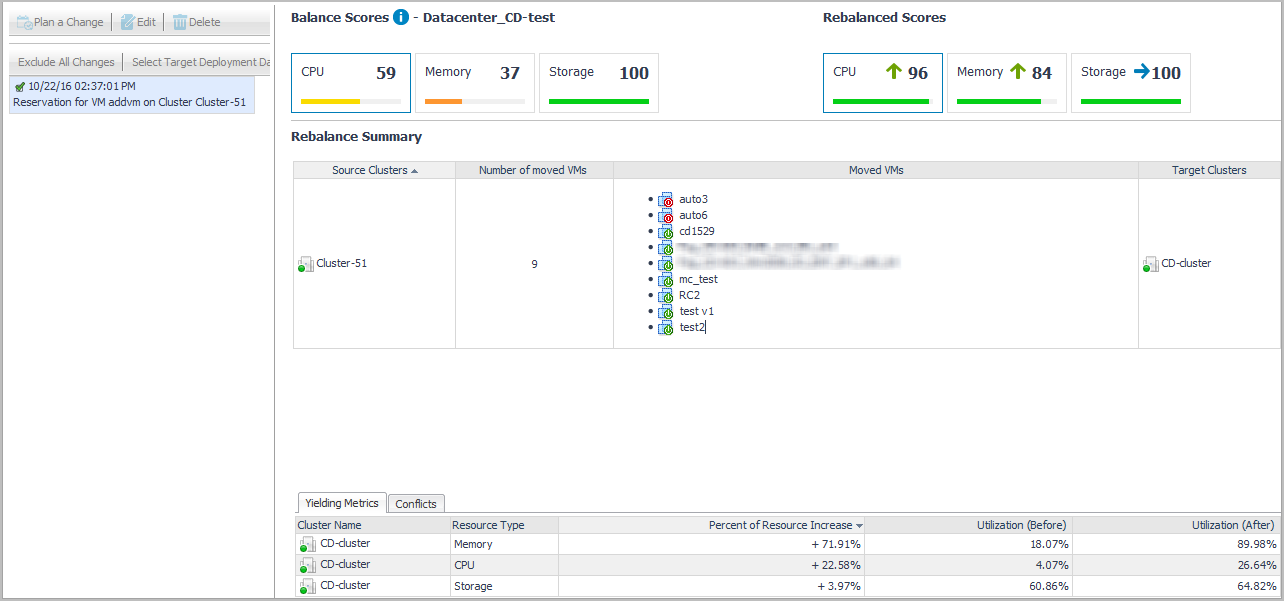
Scenario Modeler Tab
The Scenario Modeler view is intended to rebalance the workload among virtual centers or datacenters, to achieve optimal resource utilization. The balance metrics include CPU utilization, Memory utilization, and Storage Capacity utilization. A metric is defined as ‘balanced’ if the resource utilization is averagely distributed across all clusters and standalone nodes; otherwise this metric can be regarded as ‘non-balanced’. Foglight Capacity Director provides two methods to help you optimize the use of clusters resources, by using the Scenario Modeler view:
|
• |
Optimal Placement: Automatically rebalances the workload from clusters, by using an automatic algorithm that calculates and recommends the optimal distribution of virtual machines across clusters. |
|
• |
Manual Placement: Manually rebalances the workload from clusters, by moving virtual machines between clusters. |
|
NOTE: Results populated in the Scenario Modeler view are impacted if the HA policy is enabled in a virtual center. |
The left side of the Scenario Modeler view includes the Planned Changes pane and the right side is the Scenario Modeler pane that walks you through the placement procedure.