Viewing the host performance
|
TIP: By default, a sparkline is shown only in the CPU Utilization column. To display sparklines for other metric categories, click the Show columns icon ( |
You can view the dependencies for a selected host you are monitoring in the Host Monitor dashboard by clicking Host Dependencies on the General tab of the action panel. If you have the Cartridge for Dependency Mapping installed, this feature allows you to view the elements in the host’s dependency chain. For more information, see the Managing Dependency Mapping User Guide.
Determine if the state of a host impacts your services
|
TIP: In addition to the dashboards described in this chapter, Foglight provides you with other views on your hosts. For details, see the online help for the dashboards listed under Dashboards > Hosts in the navigation panel. |
Reporting on Your Enterprise
|
• |
|
• |
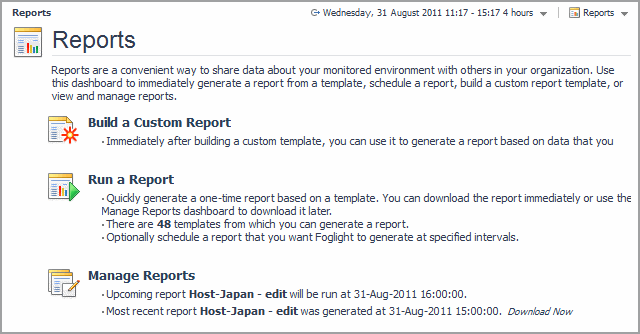
A Reports menu is located at the top-right corner of each dashboard. From this menu, you can quickly create a new report, run a report, and manage reports. You can access the same menu from the General tab on the action panel by expanding Other Actions and clicking Reports.


