SQL Server tile
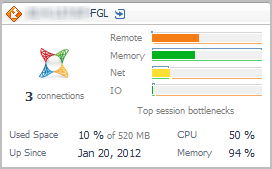
Use the SQL Server Tile to gather performance information about the state of SQL Server® database transactions monitored by Foglight for SQL Server. This tile displays the current top used resources from the list below.
Topology Object Name: DBSS_Instance
|
|
|
• |
Connections. The current average number of active connections. | |
|
|
|
• |
Top Session Bottlenecks. A breakdown of the potential session bottleneck points. The four top used resources from the list below are displayed on the tile. |
|
|
|
|
• |
Used Space. The amount of database storage space used, expressed as a percentage of the total available. | |
|
|
|
• |
Up Since. The date the database was last restarted. | |
|
|
|
• |
CPU. The average CPU usage for all SQL Server ® agents. | |
|
|
|
• |
Memory. The average memory usage for all SQL Server agents. | |
Sybase tile
Use the Sybase Tile to gather performance information about the state of Sybase® database transactions monitored by Foglight for Sybase.

Topology Object Name: Sybase_MDAAgent
|
|
|
• |
Connections. The current average number of active connections. | |
|
|
|
• |
Health History Bar. The color-coded bar represents the alarm state of the monitored component over the time range selected in the SOC. The color of the bar changes depending on the alarm state. Red indicates a Fatal state, orange indicates Critical, yellow means Warning, and green is the Normal state. | |
|
|
|
• |
Response Time. The time elapsed during database access, plotted over time. | |
|
|
|
• |
Used Space. The amount of database storage space used, expressed as a percentage of the total available. | |
|
|
|
• |
Up Since. The date the database was last restarted. | |
|
|
|
• |
CPU. The average CPU usage for all Sybase ® agents. | |
|
|
|
• |
Memory. The average memory usage for all Sybase agents. | |
Synthetics tile
The Multi-Location and Single-Location Synthetics Tiles tile show summarized data about user transactions captured by Foglight Transaction Recorder (FTR):
Multi-Location Synthetics tile
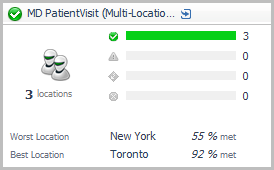
The Multi-Location Synthetics Tiles summarizes the performance of a synthetic transaction from multiple locations. Use this tile to gather performance information about the overall state of rolled up locations.
Topology Object Name: FTRResult
Click the title bar to drill down to the Synthetic User Performance detail view.
|
|
|
• |
Locations. The current number of agent locations. | |
|
|
|
• |
Location Health Breakdown. The current number of locations in each state (Normal  , Warning  , Critical  , Fatal  ), along with a color-coded bar. The length of colored bar indicates the number of locations in the corresponding state compared to the total number of locations. | |
|
|
|
• |
Worst Location. The location of the Foglight Transaction Player Intelligent Agent with the worst period average success rates. | |
|
|
|
• |
Best Location. The location of the Foglight Transaction Player Intelligent Agent with the best period average success rates. |
|
