Single-Location Synthetics tile
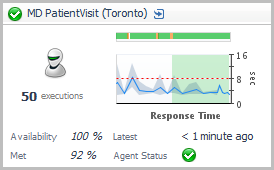
The Single-Location Synthetics tile displays a summary of a synthetic transaction from a single location.
 .
.
Topology Object Name: FTRResult
Click the title bar to drill down to the Synthetic Result detail view.
|
|
|
• |
Executions. The number of times the script executed over the time range selected. | |
|
|
|
• |
Health History Bar. The color-coded bar represents the alarm state of the monitored component over the time range selected in the SOC. The color of the bar changes depending on the alarm state. Red indicates a Fatal state, orange indicates Critical, yellow means Warning, and green is the Normal state. | |
|
|
|
• |
Response Time. The average script execution time over the time range selected. The red dashed line indicates the response time threshold. The background shading of the chart represents the status. Green shading indicates that the response time is currently good. | |
|
|
|
• |
Availability. The period average percentage of time the service is available. | |
|
|
|
• |
Met. The period average percentage of time the service met its required Service Level Agreement for the expected response time. | |
|
|
|
• |
Latest. The most recent time the script executed. | |
|
|
|
• |
Agent Status. An icon indicating the current state of the FTR agent: Normal  , Warning  , Critical  , or Fatal  . | |
Virtual Hyper-V tile
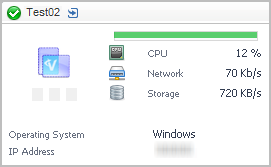
Use the Hyper-V Tile to gather performance information about the state of virtual Hyper-V® transactions monitored by the Foglight for Hyper-V.

Topology Object Name: Host
|
|
|
• |
Alarms. A count of fatal, critical, and warning alarms on the virtual Hyper-V ® instance. | |
|
|
|
• |
Health History Bar. The color-coded bar represents the alarm state of the monitored component over the time range selected in the SOC. The color of the bar changes depending on the alarm state. Red indicates a Fatal state, orange indicates Critical, yellow means Warning, and green is the Normal state. | |
|
|
|
• |
CPU. The average CPU usage for the virtual system. | |
|
|
|
• |
Network. The average network transfer rate for the virtual machine. | |
|
|
|
• |
Storage. The average disk transfer rate for the virtual machine. | |
|
|
|
|
|
|
• |
IP Address. The primary IP address for the virtual machine. | |
VMware tile
Use the VMware Tile to gather performance information about the state of a virtual machine monitored by the Foglight for VMware.

Topology Object Name: Host
Click the title bar to drill down to the Virtual Machine detail view.
|
|
|
• |
CPU Ready. The percentage of time that the virtual machine has spent waiting in the queue, ready to be scheduled on a CPU. An increase in this value indicates that the virtual machine is spending more time waiting and could be short on resources. | |
|
|
|
• |
Health History Bar. The color-coded bar represents the alarm state of the monitored component over the time range selected in the SOC. The color of the bar changes depending on the alarm state. Red indicates a Fatal state, orange indicates Critical, yellow means Warning, and green is the Normal state. | |
|
|
|
• |
CPU. The current amount of CPU resources used by the virtual machine, expressed as a percentage. | |
|
|
|
• |
Memory. The current amount of memory used by the virtual machine, expressed as a percentage. | |
|
|
|
• |
Network. The current network transfer rate for the virtual machine. | |
|
|
|
• |
Storage. The current disk transfer rate for the virtual machine. | |
|
|
|
|
|
|
• |
IP Address. The primary IP address for the virtual machine. | |
Overview of Detail views
Detail views are drill down views accessible from some tile views.
For more information about a specific view, see:

 .
.
