
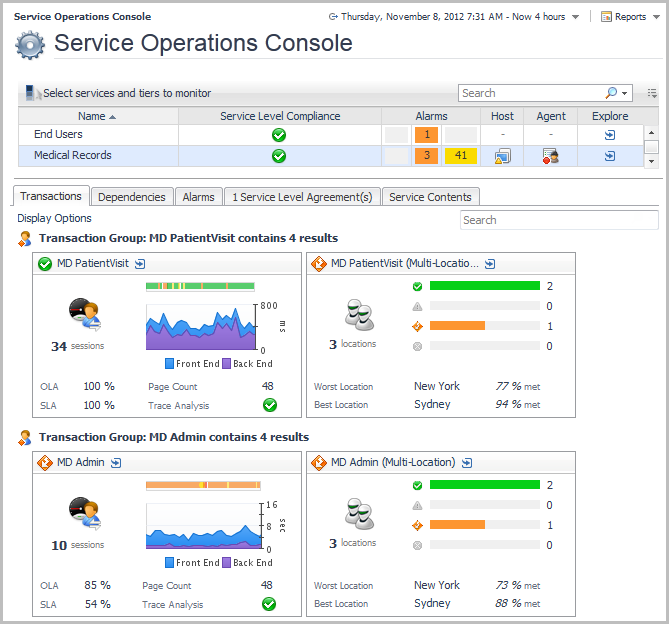
Exploring the SOC Transactions tab
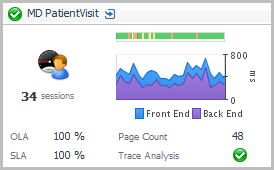
The Transactions tab displays a set of tiles representing transactional performance data collected from a number of Foglight sources. The type and dynamics of transactional data dictate the number and type of tiles that appear on this tab, along with the display options you can configure (see Configuring display options).
End user transaction groups are divided into:
|
|
Real users (Foglight APM Appliances) |
|
|
Real users (FxM or FxV) |
|
|
Synthetics (FTR or Synthetic Monitor for Internet) |
There are a number of options for controlling how end user transactions are grouped. For more information, see Configuring display options.
|
2 |
On the navigation panel, under Homes, click Service Operations Console. |
|
3 |
On the Service Operations Console, click the Transactions tab. |
Real users
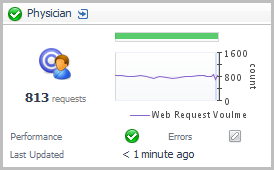
Drill down on a Real User tile (click the title bar) to open the Real User (APM) Performance detail view.
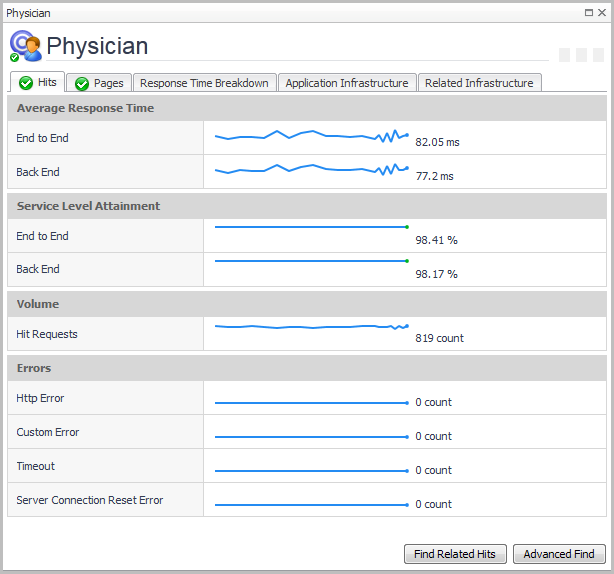
For more information about the metrics appearing on this view, see Real User (APM) Performance detail view.
The tabs available in this view depend on the monitoring capabilities of your Foglight installation.
|
• |
The Response Time Breakdown tab requires Foglight for Java EE Technologies version 5.8.2 or later, or Foglight for Microsoft .NET 5.9.1 or later. For more information, see Requirements for using the Response Time Explorer dashboard. |
|
• |
The SLA Violators tab requires FxM and a deployed and configured FxM Map Agent. For more information, see Prerequisites for using the Geographical Perspective dashboard. |
Synthetics
When a service includes synthetic user transactions, the Transactions tab displays one or more Synthetics tiles. The associated metrics are collected by Foglight Transaction Recorder (FTR). Depending on the number of tiles and the configured display options (see Configuring display options), a collection of Single-Location Synthetics layout or Multi-Location Synthetics layout tiles appear.
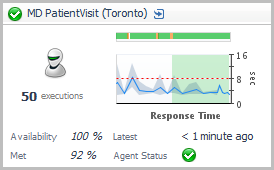
Single-Location Synthetics layout
The Single-Location Synthetics tile shows summarized data about a synthetic transaction executed from a single location. This type of layout shows the number of script executions and their execution times over the monitored period, along with other metrics. For more information about the metrics appearing on this tile, see section Single-Location Synthetics tile.
 .
.Drill down on this tile (click the title bar) to open the Synthetic Result detail view. For more information about the metrics appearing on this tile, see section Synthetic Result detail view.