Clock Skew tab
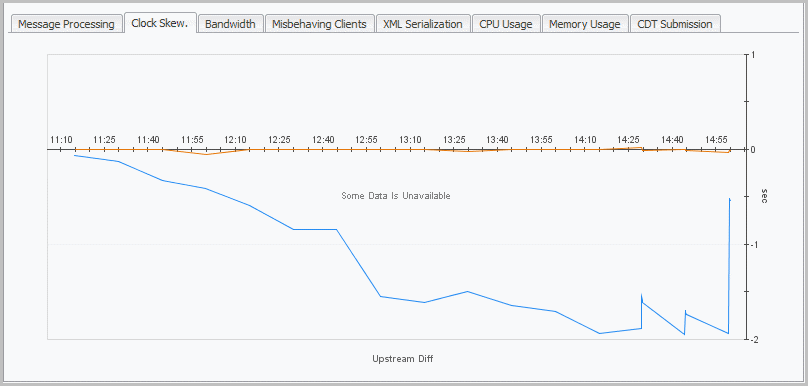
The Clock Skew tab contains a graph that displays the upstream difference per second for a selected Agent Manager instance.
Bandwidth tab
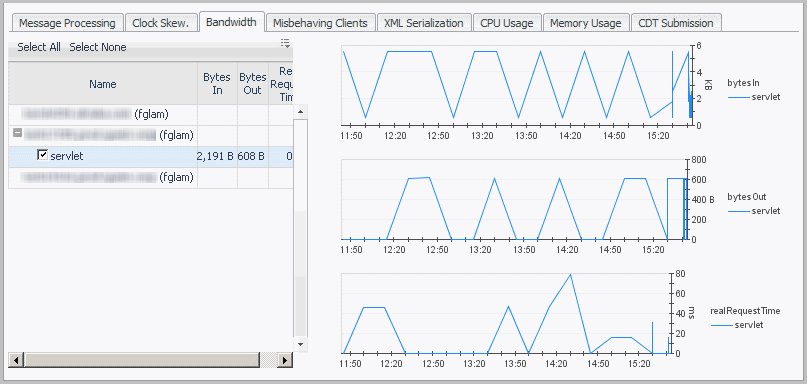
The Bandwidth tab displays metrics for bandwidth usage samples taken at prescribed intervals per second for a selected Agent Manager instance, including the bytes in, bytes out, and real request time for a selected servlet. The bandwidth statistics reflect the bandwidth (bytes per second) used by the Agent Manager instance data over a specific time interval.
Misbehaving Clients tab
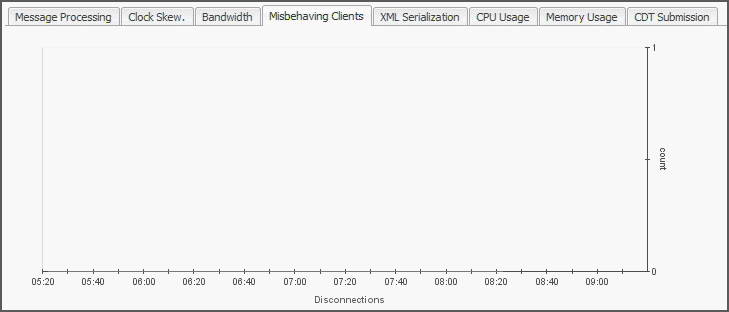
The Misbehaving Clients tab displays the disconnections per count for a selected Agent Manager instance.
XML Serialization tab
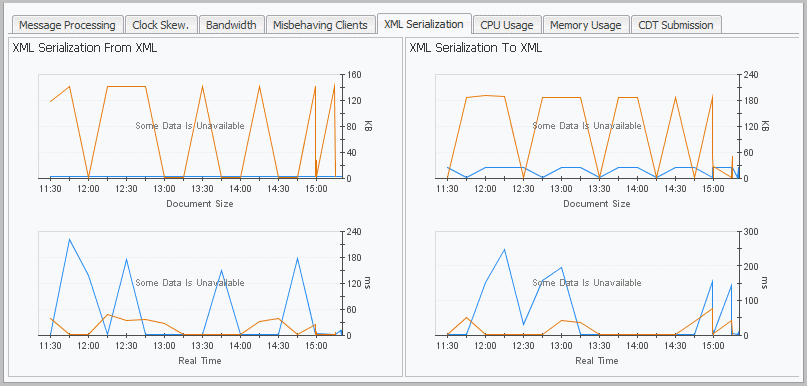
The XML Serialization tab shows graphs indicating the rates and times of message serialization to and from XML for a selected Agent Manager instance.


