Chat now with support
Chat with Support

Foglight Agent Manager 5.9.1 - Foglight Agent Manager Guide

Configuring the embedded Agent Manager Installing external Agent Managers
Understanding how the Agent Manager communicates with the Management Server Deploying the Agent Manager cartridge Downloading the Agent Manager installer Installing the Agent Manager Starting or stopping the Agent Manager process Frequently asked questions
Configuring the Agent Manager Advanced system configuration and troubleshooting
Configuring Windows Management Instrumentation (WMI) Configuring Windows Remote Management (WinRM) UNIX- and Linux-specific configuration
Monitoring the Agent Manager performance Deploying the Agent Manager to large-scale environments

Clock Skew tab

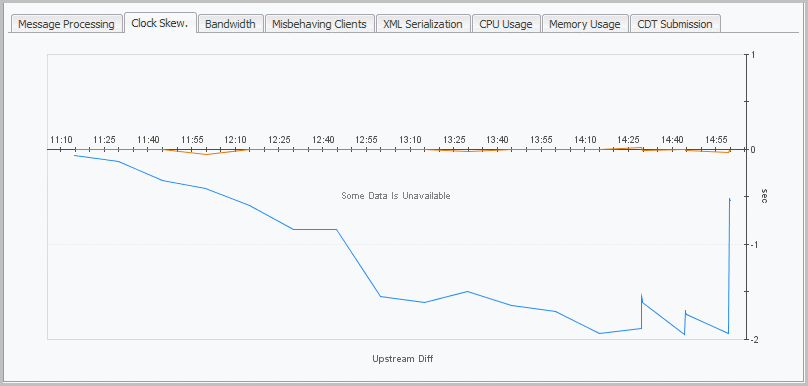
The Clock Skew tab contains a graph that displays the upstream difference per second for a selected Agent Manager instance.

Figure 7. Clock Skew tab

Bandwidth tab

The Bandwidth tab displays metrics for bandwidth usage samples taken at prescribed intervals per second for a selected Agent Manager instance, including the bytes in, bytes out, and real request time for a selected servlet. The bandwidth statistics reflect the bandwidth (bytes per second) used by the Agent Manager instance data over a specific time interval.

Figure 8. Bandwidth tab

Misbehaving Clients tab

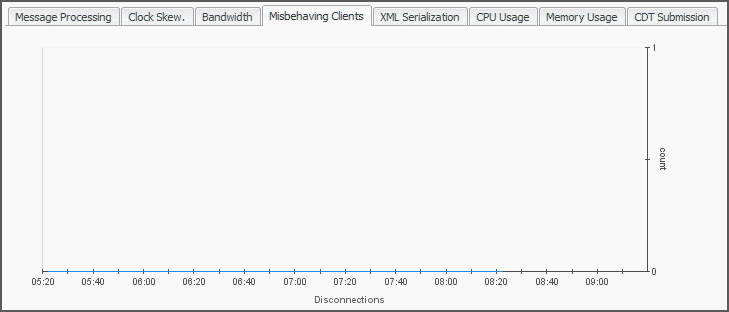
The Misbehaving Clients tab displays the disconnections per count for a selected Agent Manager instance.

Figure 9. Misbehaving Clients tab

XML Serialization tab

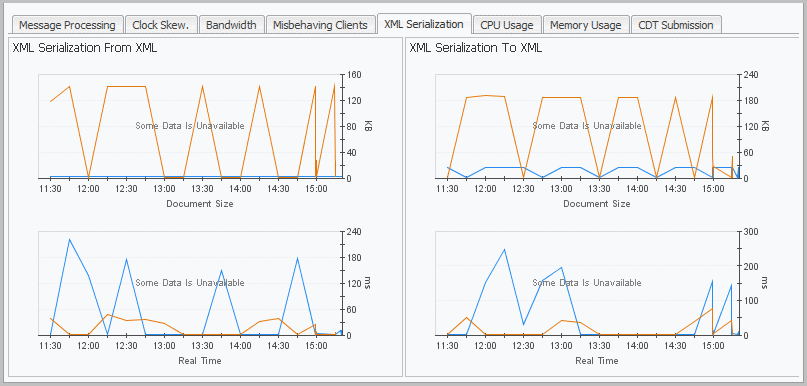
The XML Serialization tab shows graphs indicating the rates and times of message serialization to and from XML for a selected Agent Manager instance.

Figure 10. XML Serialization tab

Related Documents

The document was helpful.

Select Rating

I easily found the information I needed.

Select Rating