
About the KACE Systems Management Appliance
About the appliance components
About the Administrator Console
Getting started
Components available in Admin mode without the Organization component
Components available in Admin mode with the Organization component enabled
Components available in System mode with the Organization component enabled
Using the Home component
About Dashboards
View the Dashboard in Admin mode
View the Dashboard in System mode
Customize Dashboard pages
About Dashboard widgets
View Dashboard details
View task schedules
View the appliance version, model, and license information
View product licensing information
About appliance software updates
About labels
Searching for information and filtering lists
Search at the Admin level
Search at the page level
Searching at the page level with advanced options
Log in to the Administrator Console: First login following initial network configuration
Example: Search for managed devices using Advanced Search criteria
Add Smart Labels and Notifications using Advanced Search criteria
Load Smart Labels from the Advanced Search tab
Create Custom Views using Advanced Search criteria
Access product documentation
Configuring the appliance
Managing inventory
Requirements and specifications
Power-on the appliance and log in to the Administrator Console
Access the Command Line Console
Tracking configuration changes
Configuring System-level and Admin-level General Settings
Setting up and using labels to manage groups of items
Configure appliance General Settings with the Organization component enabled
Configure Admin-level or organization-specific General Settings
Configure appliance General Settings without the Organization component
Configure appliance date and time settings
Managing user notifications
Enable Two-Factor Authentication for all users
Verifying port settings, NTP service, and website access
Verify port settings
Verifying the status of the NTP service
Make necessary websites accessible to the appliance
Configuring network and security settings
Change appliance network settings
Configure local routing tables
Configure local web server settings and allow access to hosts
Configure security settings for the appliance
Configure Active Directory as the single sign on method
Generate an SSL certificate
Configuring Agent settings
Configuring session timeout and auto-refresh settings
Configuring locale settings
How locale settings are applied
Configure locale settings for the Administrator Console and the Command Line Console
Configure locale settings for the User Console
Configure locale settings for organizations
Configure locale settings for users
Configuring the default theme
Configure data sharing preferences
About DIACAP compliance requirements
Configuring Mobile Device Access
Enable Mobile Device Access for the appliance
Enable Mobile Device Access for users
Download and use KACE GO
Disable Mobile Device Access on the appliance
Disable Mobile Device Access for users
Enable fast switching for organizations and linked appliances
Linking Quest KACE appliances
Enable appliance linking
Add Names and Keys to appliances
Enable access to Federation API settings
Disable appliance linking
Configuring history settings
About history settings
Managing settings history
Configure settings history subscriptions for organizations
Configure System-level settings history subscriptions with the Organization component enabled
View settings history
Managing asset history
Managing object history
Using change history information
About labels
Tracking changes to label settings
Managing manual labels
Managing Smart Labels
Configuring user accounts, LDAP authentication, and SSO
Add Smart Labels
Example: Combine Smart Labels to identify devices
Edit Smart Labels
Setting up labels for user accounts
Using Smart Labels for patching
Using Smart Labels with Discovery Results
Adding Smart Labels for devices
Assign the Smart Label run order
Delete Smart Labels
Managing label groups
Add, view, or edit label groups
Assign labels to or remove labels from label groups
Delete label groups
Managing LDAP Labels
About user accounts and user authentication
About locale settings
Managing System-level user accounts
Deploying the KACE Agent to managed devices
Using Replication Shares
Managing credentials
Add or edit System-level user accounts
Manage appliance administrator email notifications
Delete System-level user accounts
Managing organization user accounts
Add or edit User Roles
Delete User Roles
Add or edit organization user accounts
Customize user details
Archive user accounts
View or edit user profiles
Using an LDAP server for user authentication
Importing users from an LDAP server
About single sign on (SSO)
Enabling and disabling single sign on
Using Active Directory for single sign on
Configure Active Directory as the single sign on method
Configuring browser settings for single sign on
Configure SAML for single sign on
Reviewing user sessions
Configure Microsoft Edge browser settings
Configure Firefox browser settings
Use Active Directory single sign on to access the Administrator Console or User Console
Unjoin the domain and disable Active Directory single sign on
Tracking changes to Credentials Management settings
Add and edit Secret Key credentials
Add and edit User/Password credentials
Add and edit LDAP User/Password credentials
Add and edit Google Workspace credentials
Add and edit SNMP credentials
Add and edit Microsoft Office 365 OAuth credentials
View credential usage
Create reports from the Credentials Management list
Export credentials information
Delete credentials
Configuring assets
About the Asset Management component
Using the Asset Management Dashboard
About managing assets
Setting up License Compliance
How asset information differs from inventory information
Identifying the assets to track
View assets and search for asset information
Add barcodes to assets
Change device owners
View and configure asset lifecycle settings
Adding and customizing Asset Types and maintaining asset information
About Asset Types
Customizing Asset Types
Managing Software assets
Managing physical and logical assets
Maintaining and using manual asset information
Managing locations
Managing contracts
Managing licenses
Managing purchase records
About renaming fields and changing field types in Asset Types
About adding and deleting asset fields
Add or customize Asset Types
About customizing the Device Asset Type
Example: Add custom fields to the Device Asset Type
Establishing relationships between asset fields
Delete Asset Types
About Asset Subtypes, custom fields, and device detail preferences
Workflow for using Asset Subtypes with SNMP devices
Add Asset Subtypes and select Device Detail page preferences
Edit Asset Subtypes
Set an Asset Subtype as the default
View subtypes available to Asset Types
View Asset Subtypes on the Assets page
Assign or change Device Asset Subtypes from the Devices page
Assign assets to subtypes or change subtype assignments from the Assets page
Update custom asset fields manually
Delete Asset Subtypes
About License Compliance for Software Catalog applications
Customize the License Asset Type
Add License assets for Software Catalog inventory
Add License assets for Software page inventory
Importing license data in CSV files
Managing License Compliance
View License Compliance information for Software Catalog applications
Reclaim unused software licenses
Update software License Compliance information manually
Customize license usage warning thresholds
View License Compliance and Configuration information
Setting up Service Desk
Setting up roles for user accounts
Configure the Cache Lifetime for Service Desk widgets
Creating and managing organizations
About default roles
Create a Service Desk staff role
Assign user roles
Apply labels and roles to Service Desk staff
Create the DefaultTicketOwners account
Configuring email settings
About email notifications
About Ticket Rules
About POP3 email accounts
Create and configure POP3 email accounts
Configure email preferences
Configuring email triggers and email templates
Configure CC lists for ticket categories
Automatically add email addresses to ticket CC List fields
Exclude addresses from ticket CC List fields
Prevent email loops
About organizations
Tracking changes to organization settings
Managing Organization Roles and User Roles
Adding, editing, and deleting organizations
Importing and exporting appliance resources
Add or edit organizations
Configure Two-Factor Authentication for organizations
Delete organizations
Customizing the logos used for the User Console and organization reports
Managing user accounts for organizations
Managing organization filters
How organization filters work
Add or edit organization Data Filters
Add or edit organization LDAP Filters
Test organization filters
Delete organization filters
Managing devices within organizations
Understanding device details
Running single organization and consolidated reports
Using the Inventory Dashboard
Using Device Discovery
Deploying packages to managed devices
About Device Discovery and device management
Tracking changes to Discovery settings
Discovering devices on your network
Managing device inventory
Add a Discovery Schedule to perform a quick "what and where" scan of your network
Add a Discovery Schedule for a thorough scan of managed Windows, Mac, Linux, and UNIX computers
Obtain a Client ID and Client Secret for use in discovering Chrome devices
Add a Discovery Schedule for a KACE Cloud Mobile Device Manager device
Add a Discovery Schedule for a G Suite device
Add a Discovery Schedule for an Workspace ONE device
Add a Discovery Schedule for a VMware ESXi host or a vCenter Server
Add a Discovery Schedule for a Microsoft Hyper-V or System Center Virtual Machine Manager
System Center Virtual Machine Manager Credential Requirements
Add a Discovery Schedule for SNMP-enabled non-computer devices
About Discovery Results
View and search Discovery Results
Provision the Agent using the discovered IP address or hostname
Stop a running discovery scan
Delete Discovery Schedules
About managing devices
Features available for each device management method
About inventory information
Tracking changes to inventory settings
Managing inventory information
Managing applications on the Software page
Add custom data fields
Schedule inventory data collection for managed devices
View device inventory and details
Viewing information about devices enrolled in KACE Cloud MDM
Groups and sections of items in device details
About Dell Data Protection | Encryption (DDP|E) and encryption information in device details
Add a Dump Inventory registry key to permit inventory collection on Windows DDP|E client devices
Finding and managing devices
Add the DumpXmlInventory registry key to an Agent-managed Windows device
Add the DumpXmlInventory registry key to an Agentless-managed Windows device
About Intel AMT information in device details
Finding devices in inventory
Labeling devices to group them
Run actions on devices
View devices that have been added manually
Delete devices from inventory
Registering KACE Agent with the appliance
Provisioning the KACE Agent
Enabling file sharing
Manually deploying the KACE Agent
Enable file sharing at the System level
Enable organization-level file sharing with the Organization component enabled
Enable file sharing without the Organization component enabled
Provisioning the KACE Agent using the GPO Provisioning Tool for Windows devices
Prepare to use the GPO Provisioning Tool for Agent deployment
Provision KACE Agents using the appliance GPO Provisioning Tool
Provisioning the KACE Agent using onboard provisioning
Managing provisioning schedules
View, run, edit, or duplicate provisioning schedules
Delete provisioning schedules
View provisioning results
Managing Agent communications
Configure Agent communication and log settings
View Agent task status
View the Agent Command Queue
Delete messages from the Agent command queue
Updating the KACE Agent on managed devices
Obtaining Agent installation files
Manually deploying the KACE Agent on Windows devices
Using Agentless management
Manually deploy the KACE Agent on Windows devices using the installation wizard
Manually deploy the KACE Agent on Windows devices using the Command line
Manage the KACE Agent on Windows devices using the Windows system tray
Manually deploying and upgrading the KACE Agent on Linux devices
Manually deploy the KACE Agent on Linux devices
Deploy the KACE Agent on Linux devices at startup or login
Upgrade the KACE Agent on Linux devices
Performing Agent operations on Linux devices
Start and stop the Agent on Linux devices
Manually remove the Agent from Linux devices
Verify that the Agent is running on Linux devices
View the Agent version on Linux devices
Collecting inventory information
Manually deploying and upgrading the KACE Agent on Mac devices
Deploy or upgrade the KACE Agent to Mac devices using the Agent installer
Deploy the Agent to Mac devices using the terminal window
Use shell scripts to deploy the KACE Agent
Performing other Agent operations on Mac devices
Start or stop the Agent on Mac devices
Manually remove the Agent from Mac devices
Verify that the Agent is running on Mac devices
Verify the version of the Agent on Mac devices
Collecting inventory information from Mac devices
Manage the KACE Agent on Mac devices using the menu bar
Viewing information collected by the Agent
About Agentless device management
Adding devices manually in the Administrator Console or by using the API
Operating systems supported by Agentless management
About enabling Agentless management on Agent-managed devices
Managing Agentless devices
Enable Agentless management using Discovery information
Enable Agentless management by entering device information manually
Shell support for SSH connections
Edit Agentless device connection details or delete Agentless devices
Using SNMP Inventory Configurations to identify specific SNMP objects and non-computer devices to add to inventory
About managing devices
Tracking changes to inventory settings
Add devices manually with the Administrator Console
Adding devices manually using the API
Forcing inventory updates
Force inventory updates from the appliance
Force inventory updates from Windows devices
Force inventory updates from Mac OS X devices
Force inventory updates from Linux devices
Managing MIA devices
Configure MIA settings
Apply labels to MIA devices
Delete MIA devices manually
Troubleshoot devices that fail to appear in inventory
Obtaining Dell warranty information
About the Software page
Tracking changes to inventory settings
Adding and deleting applications in Software page inventory
Creating Software assets
Managing Software Catalog inventory
Add Software assets in the Inventory section
Add Software assets in the Assets section
Attach digital assets to applications and select supported operating systems
Copy files to the appliance Client Drop location
Using software threat levels and categories
Finding and labeling applications
About finding applications using Advanced Search
Add manual software labels
Apply manual labels to or remove labels from software
Add software Smart Labels
Managing the ITNinja feed
About the Software Catalog
Managing process, startup program, and service inventory
Application classifications
About cataloged applications
About Locally Cataloged applications
About Not Allowed applications
Application categories
How Software Catalog information is collected
How the Software Catalog is used with the Organization component
How Software Catalog information is localized
How you can help improve the Software Catalog
Differences between the Software page and the Software Catalog page
Viewing Software Catalog information
View lists of Discovered and Not Discovered applications
View the list of Uncataloged applications
View the list of Locally Cataloged applications
View details of Software Catalog applications
Adding applications to the Software Catalog
Submitting cataloging requests automatically adds applications to the local Software Catalog
How Locally Cataloged applications change to Cataloged applications
How custom names are resolved when Locally Cataloged applications are added to the Software Catalog
Submit cataloging requests
Cancel cataloging requests and remove local cataloging
Managing License assets for Software Catalog applications
Add License assets for Software Catalog inventory
Migrate License assets to applications in the Software Catalog
Associate Managed Installations with Cataloged Software
Using software metering
About software metering
About metering information
Enabling and configuring metering for devices and applications
Using Application Control
Choosing the devices and applications to meter
Enabling metering on devices
Enable metering on devices using manual labels
Enable metering on devices using Smart Labels
Enable metering for Software Catalog applications
Configure options for metering Software Catalog applications
Viewing Software Catalog metering information
View metering information on the Software Catalog Detail page
View metering information on the Device Detail page
Disabling metering for Software Catalog applications and managed devices
Managing metering and scheduling inventory collection
Requirements for blocking applications
How applications are blocked
About denying access to application editions that share executable files
Applications that cannot be blocked
Apply the Application Control label to devices
Mark applications and suites as Not Allowed
View applications and suites that are marked as Not Allowed
Create reports showing applications marked as Not Allowed
Remove the Not Allowed designation from applications
Update or reinstall the Software Catalog
Managing process inventory
Writing custom inventory rules
View and edit process details
Add labels for processes
Apply labels to or remove labels from processes
Categorize processes
Assign threat levels to processes
Delete processes
Managing startup program inventory
View and edit startup program details
Add labels for startup programs
Apply labels to or remove labels from startup programs
Categorize startup programs
Assign threat levels to startup programs
Delete startup programs
Managing service inventory
Distributing software and using Wake-on-LAN
Patching devices and maintaining security
About software distribution
Tracking changes to distribution settings
Types of distribution packages
Distributing packages from the appliance
Distributing packages from alternate download locations and Replication Shares
Distributing applications to Mac OS X devices
Using Managed Installations
Broadcasting alerts to managed devices
Running scripts on managed devices
Adding applications to inventory
About creating Managed Installations
About installation parameters
Identify parameters that are supported by installer files
Create Managed Installations for Windows devices
Examples of common deployments on Windows
Create Managed Installations for ZIP files
Create Managed Installations for RPM files
Create Managed Installations for TAR.GZ files
Create Managed Installations for Mac OS X devices
Create and use File Synchronizations
Using Wake-on-LAN
Exporting Managed Installations
About scripts
Tracking changes to scripting settings
About default scripts
Adding and editing scripts
Managing Mac profiles
Token replacement variables
Add offline KScripts, online KScripts, or online shell scripts
Edit scripts
Delete scripts from the Scripts page
Delete scripts from the Script Detail page
Structure of importable scripts
Import scripts
Duplicate scripts
Using the Run and Run Now commands
Run scripts from the Run Now page
Run scripts from the Script Detail page
Run scripts from the Scripts page
Monitor Run Now status and view script details
About configuration policy templates
Using Windows configuration policies
About starting Windows Automatic Updates on Windows devices
About Dell Command | Monitor
Add Dell Command | Monitor scripts
Add Desktop Wallpaper scripts
Add Desktop Shortcuts scripts
Add Event Log Reporter scripts
Add MSI Installer scripts
About power management and power consumption
Add power management scripts for Windows devices
Add Registry scripts
Add Remote Desktop Control Troubleshooter scripts
Add UltraVNC scripts
Add Uninstaller scripts
Using Mac OS X configuration policies
Edit policies and scripts
Search the scripting logs
Exporting scripts
Tracking changes to Mac profile settings
Adding, editing, and uploading Mac profiles
Using Task Chains
Add or edit Mac user profiles
Add or edit Mac system profiles
Add Mac profiles using existing profiles as templates
Upload Mac profiles to the appliance
Installing and managing Mac profiles
Distribute Mac profiles on a schedule
Install Mac profiles on devices using the Run option
Identify devices that have Mac profiles installed
View Mac profiles
Export the Mac profiles list
Removing and deleting Mac profiles
Using the Security Dashboard
About patch management
Using reports and scheduling notifications
Patching workflow
About patch signature files
About patch packages
About patch testing and security
About the patch quality assurance process
Best practices for patching
Subscribing to and downloading patches
About patch subscription and downloads
Websites that must be accessible to the appliance
Overview of first-time patch-subscription workflow
View details about operating systems and applications
Subscribing to patches and configuring download settings
Viewing available patches and download status
Best practices for resolving patch subscription issues
Creating and managing patch schedules
About scheduling critical OS patches for desktops and servers
About scheduling critical patches for laptops
About scheduling non-critical patches
Configuring patch schedules
Viewing patch schedules, status, and reports
Managing patch inventory
View a list of patch schedules
Review patch schedule details
Patching status definitions
View patch status
View patch status by device
View files within patches
View patch reports
Managing patch rollbacks
Prerequisites for managing patch inventory
Viewing patch information
Managing Windows Feature Updates
View downloaded patches
View patch details
Resetting the number of patch deploy attempts
Viewing patch statistics and logs
Mark patches as inactive
Patch Mac OS X devices
Reset the number of patch deploy attempts from the patch Catalog
Reset the number of patch deploy attempts from the patch detail page
View patch information for devices in inventory
View devices missing patches
Subscribe to Windows Feature Updates
Configure Windows Feature Update schedules
View Windows Feature Update schedules
Review Windows Feature Update schedule details
View available Windows Feature Updates
View Windows Feature Update status
Managing Dell devices and updates
Differences between patching and Dell Updates
Select Dell Update download settings
Configure Dell Update schedules
View Dell Update schedules
Review Dell Update schedule details
View available Dell Updates
View Dell Update status
Managing Linux package upgrades
View Linux package upgrade schedules
Configure Linux package upgrade schedules
Review Linux package upgrade schedule details
Review Linux package upgrades
Maintaining device and appliance security
Testing device security
Manage quarantined file attachments
About OVAL security checks
Understanding OVAL tests and definitions
Maintaining appliance security
View OVAL tests and definitions
Running OVAL tests
Using labels to restrict OVAL tests
Understanding OVAL updates
Configure OVAL Settings
View the OVAL vulnerability report
Apply labels to affected devices
View the OVAL Report
About SCAP
SCAP supported versions and platforms
How the appliance conducts SCAP scans
Definitions of SCAP standards
About benchmarks
How a SCAP scan works
Access SCAP Scan information
View and manage benchmarks
Import and modify benchmarks
Configure SCAP schedules
Editing SCAP scan schedules
View the resolved XCCDF files
View the OVAL timestamp
View script tasks
View SCAP scan results
Download benchmarks from the archive
Resolve Windows security issues that prevent Agent provisioning
About reports and notifications
Creating and modifying reports
Monitoring servers
Creating reports
Scheduling reports and notifications
Create reports using the report wizard
Create reports using SQL queries
Create reports from list pages
Duplicate reports
Edit SQL statements on reports created with the report wizard
Create reports from history lists
Modifying reports
Customizing logos used for reports
Getting started with server monitoring
Using the Service Desk
Enable monitoring for a device
Working with monitoring profiles
Enable monitoring for one or more servers from the Devices inventory list
Enable monitoring for a server from its Device Detail page
Obtain a new license key to increase server monitoring capacity
Apply a new license key to increase server monitoring capacity
Edit a profile
Configure SNMP trap messages and alerting criteria
Create a new profile using a default profile as a template
Profile log paths for MySQL and Apache
Upload a profile that was created by another user
Download a profile so that it can be used by others
Bind an additional profile to a device
Define nonstandard log date format
Configuring application and threshold monitoring with Log Enablement Packages
Managing monitoring for devices
Install one or more LEPs on monitored devices
Set up a Windows Server 2003 device with an ITNinja monitoring Log Enablement Package (LEP)
Edit the monitoring Log Enablement Package (LEP) for a Windows Server 2008 or higher device
Edit the monitoring Log Enablement Package (LEP) for a Windows Server 2003 device
Pause monitoring for a device
Pause or resume monitoring for multiple devices
Set the polling interval and any automatic dismissal or deletion of alerts
Disable ping probe
Receive alerts when device configurations change
Schedule a Maintenance Window during which time alerts are not collected from a device
Create and assign monitoring-specific roles
Disable monitoring for one or more devices
Enable monitoring for one or more devices
Working with alerts
Add notification schedules from the Monitoring Alerts list page
Create a Service Desk ticket from an alert
Search for alerts using Advanced Search criteria
Filtering alerts using the Include Text and Exclude Text capability
Filter alerts using the Include Text and Exclude Text capability from the Profile Details page
Filter alerts using the Exclude Text capability from the Monitoring Alerts list page
Examples of Include Text and Exclude Text for monitoring profiles
Dismiss an alert
Retrieve and review alerts that have been dismissed from the alerts list
Delete alerts
Configuring Service Desk
Maintenance and troubleshooting
System requirements
About Service Desk
Overview of setup tasks
Import tickets from another system
Configuring Service Desk business hours and holidays
Configuring Service Level Agreements
Configuring Service Desk ticket queues
Using the Service Desk Dashboard
Managing Service Desk tickets, processes, and reports
Configure ticket queues
Configure queue-specific email settings
Rename Service Desk titles and labels
Enable or disable the conflict warning
View and edit response templates
Configuring ticket settings
Customizing the User Console home page
Change the User Console logo and text at the System level
Change the User Console logo and login text at the Admin-level
Show or hide action buttons and widgets on the User Console home page
Show or hide links to Knowledge Base articles on the User Console home page
Add, edit, hide, or delete User Console announcements
Prioritize User Console announcements or mark an announcement as urgent
Add, edit, or delete custom links on the User Console home page
Add ticket links to the User Console home page
Add a quick-action link for reporting problems on the User Console home page
About the session timeout period
Using the Satisfaction Survey
Enable or disable security for Service Desk attachments
Overview of Service Desk ticket lifecycle
Creating tickets from the Administrator Console and User Console
Managing Service Desk ticket queues
Create tickets from the User Console
Create tickets from the Administrator Console Ticket page
Create tickets from the Device Detail page
Create tickets from the Asset Detail page
Create a Service Desk ticket from an alert
Creating and managing tickets by email
About attachments to tickets created through email
Enable email ticket creation
Create a ticket by email
Modifying ticket attributes using email
Clearing a ticket field using email
Changing ticket fields using email
Changing ticket approval fields using email
Viewing tickets and managing comments, work, and attachments
Navigate among tickets, related devices, and assets
Add work information for tickets
Use default views for tickets
Create custom views for tickets
Set a view as the default view for tickets
Add comments to tickets
Add owner-only comments to tickets
View ticket comments
Add or delete screen shots and attachments from Service Desk tickets
View ticket activity history
Send ticket information through email
Run Device Actions from tickets
Merging tickets
Enable ticket merge
Merge tickets from the Tickets list page
Merge tickets from the Ticket Detail page
Using the ticket escalation process
Understanding ticket states
Understanding the escalation time limit
Understanding escalation
Changing ticket escalation settings
Change the list of escalation email recipients
Change the escalation time limits
Change the default escalation email message
Using Service Desk processes
Add, edit, and enable process templates
Define process types
Create process tickets to manage related tasks
Create process tickets by email
View process information
Cancel or complete process tickets
Delete process templates
Convert process tickets to regular tickets
Convert regular tickets to process tickets
Using Ticket Rules
Using and configuring system Ticket Rules
Understanding and customizing system Ticket Rules
Create custom Ticket Rules
Duplicate a custom Ticket Rule
Delete a custom Ticket Rule
Move a Ticket Rule from one queue to another
Run Service Desk reports
Archiving, restoring, and deleting tickets
Enable ticket archival
Configure queue archive settings
Archive selected tickets
Restore archived tickets
Delete archived tickets
Managing ticket deletion
About Service Desk ticket queues
Adding and deleting queues
Viewing tickets in queues
Setting the default queue
Set the default fields for the All Queues ticket list
Move tickets between queues
Bulk edit tickets in a queue
About User Downloads and Knowledge Base articles
Managing User Downloads
Customizing Service Desk ticket settings
Add User Downloads
Apply labels to User Downloads
Remove labels from User Downloads
Delete User Downloads
Managing Knowledge Base articles
About customizing Service Desk ticket settings
Create ticket categories and subcategories
Customizing ticket values
Customizing ticket layout
Configuring SMTP email servers
Customize Layout and Related Ticket Fields
Configure Comment Field Options
Define custom ticket fields
Customize the ticket list layout
Manage ticket templates
Configure a ticket template
Preview ticket layout
Using parent-child ticket relationships
Enable parent-child ticket relationships for a queue
Enable parent tickets to close child tickets
Create child tickets for any ticket
Designate tickets as parents and add existing tickets as their children
Use a parent ticket as a to-do list
Use parent tickets to organize duplicate tickets
Using ticket approvers
Maintaining the appliance
Appendixes
Glossary
About us
Legal notices
Tracking changes to settings
About appliance backups
Troubleshooting the appliance
Set the daily backup schedule and the number of backups to retain
Back up the appliance manually
Download backup files from the Administrator Console
Access backup files through FTP
About deleting appliance backup data
Configure offboard backup transfer
Restoring the appliance
Restore the appliance using the most recent backup
Upload backup files to the appliance
Restore the appliance from backups
Restore the appliance to factory settings
Updating appliance software
Check for and apply advertised appliance updates
Upload an update file to the appliance manually
Verify updates
Update the appliance license key
Reboot or shut down the appliance
Update OVAL definitions from KACE
Understanding the daily run output
Using Troubleshooting Tools
Verify the status of devices on the network
Identify device issues
Enable a tether to Quest KACE Support
Troubleshooting appliance issues
Troubleshooting and debugging the KACE Agent
Testing and troubleshooting email communication
Test outgoing email
Test incoming email
Use Telnet to test incoming email
Access appliance logs to view Microsoft Exchange Server errors
Troubleshooting email errors
About Diagnostic Console Two-Factor Authentication
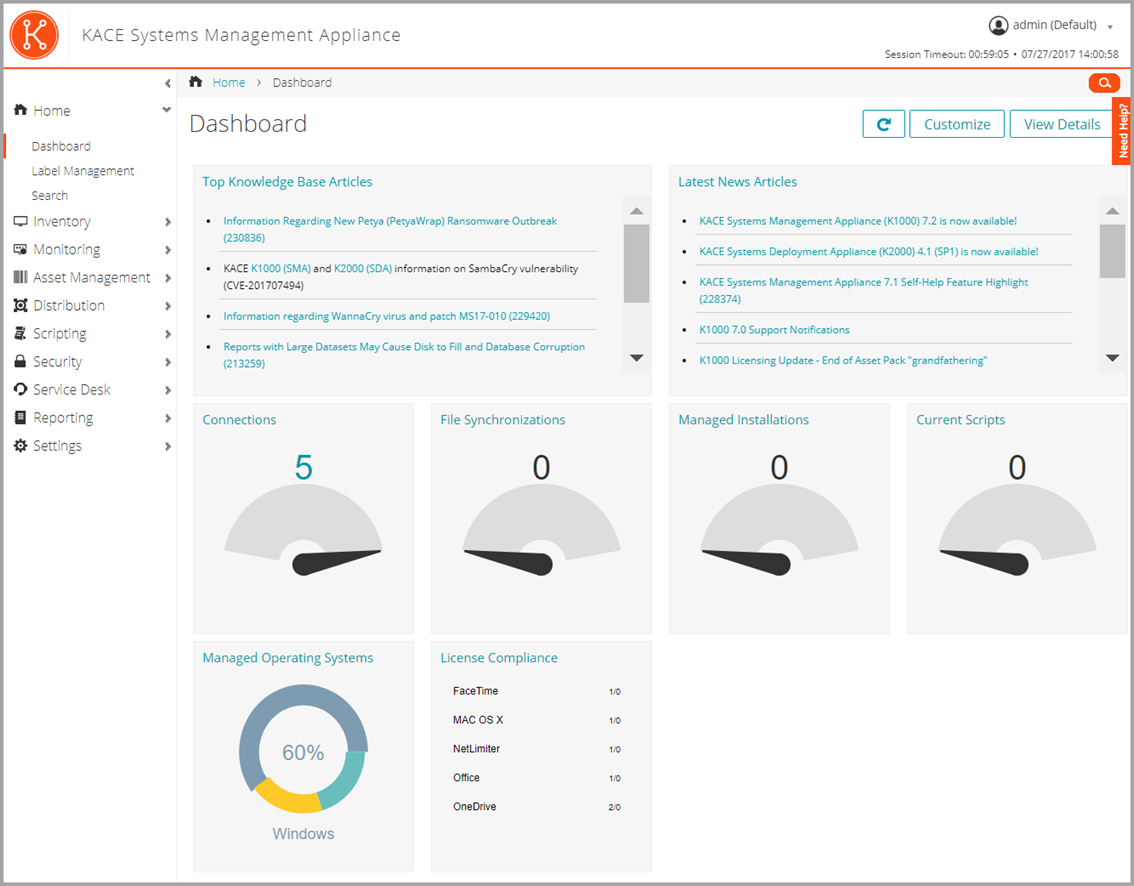
View the Dashboard in Admin mode
View the Dashboard in Admin mode
|
• |
Log in to the Administrator Console , http://appliance_hostname/admin. Or, if Show organization menu in admin header is enabled, select an organization in the drop-down list in the top-right corner of the page next to the login information. |
The Dashboard page appears.
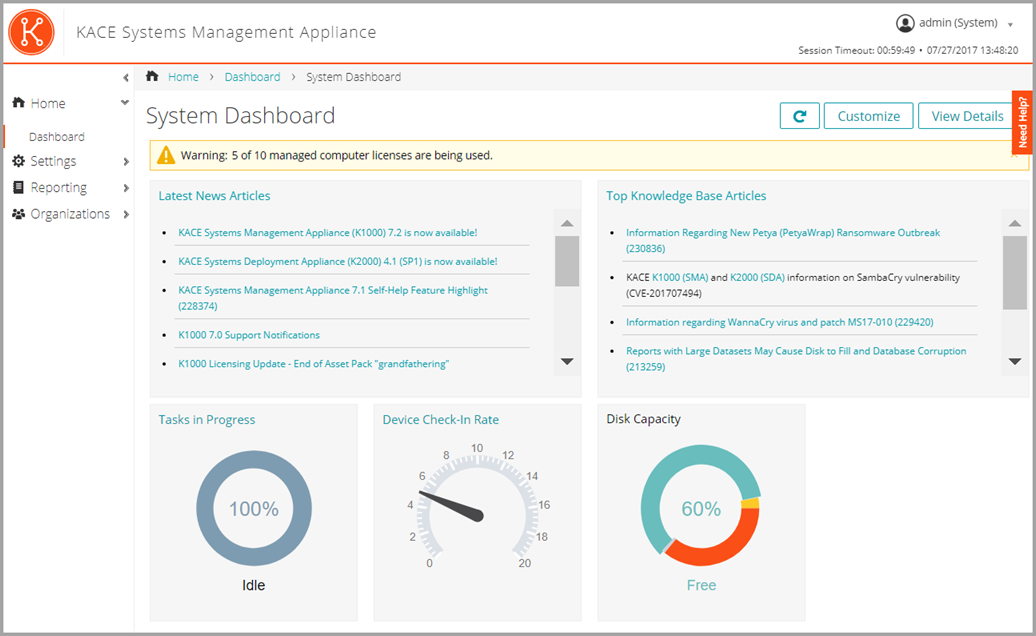
View the Dashboard in System mode
View the Dashboard in System mode
|
• |
Log in to the appliance System Administration Console, https://appliance_hostname/system, or select System from the drop-down list in the top-right corner of the page. |
The System Dashboard page appears.
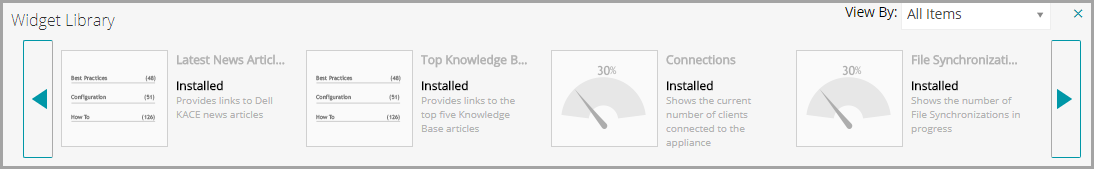
Customize Dashboard pages
Customize Dashboard pages
You can customize Dashboard pages to show or hide widgets as needed.
|
◦ |
Log in to the appliance Administrator Console, https://appliance_hostname/admin. Or, if Show organization menu in admin header is enabled in the appliance General Settings, select an organization in the drop-down list in the top-right corner of the page next to the login information. |
|
◦ |
Log in to the appliance System Administration Console, https://appliance_hostname/system, or select System from the drop-down list in the top-right corner of the page. |
|
◦ |
|
|
◦ |
|
|
◦ |
|
|
◦ |
|
|
◦ |
|
|
4. |
|
5. |
|
6. |
|
7. |
|
8. |
|
9. |
|
10. |
About Dashboard widgets
About Dashboard widgets
Dashboard widgets provide overviews of organization or appliance activity.
This section describes the widgets available on the Dashboard. If the Organization component is enabled on your appliance, widgets show the information for the selected organization at the Admin level and for the appliance at the System level.