View reference
Foglight displays monitoring data in views that group, format, and display data. The main types are described below.
Dashboards are top-level views that contain lower-level views. The dashboards supplied with Foglight, as well as those created by users, are accessible from the navigation panel.
Lower-level views in Foglight can be added to dashboards or can be accessed by drilling down from a dashboard. They receive and display data directly from the Management Server or from other views. Some views filter or select data that appears in other views in the same dashboard. Some are tree views with expandable nodes for selecting servers, applications, or data.
Foglight Net Monitor ships with several dashboards that allow you to monitor and configure your monitored environment. Each of these dashboards contains a number of views. This section describes these views in more detail. For more information about the available dashboards, see Managing monitored network devices and Investigating the performance of network devices.
This cartridge includes the following groups of views:
Net Monitor Devices Management views
The Devices Management dashboard contains the following views:
Agent Alarms view
The Agent Alarms view displays the alarms generated against the existing agents.

On the Devices Management dashboard, this view appears just below the Devices Management table.
Devices Management table
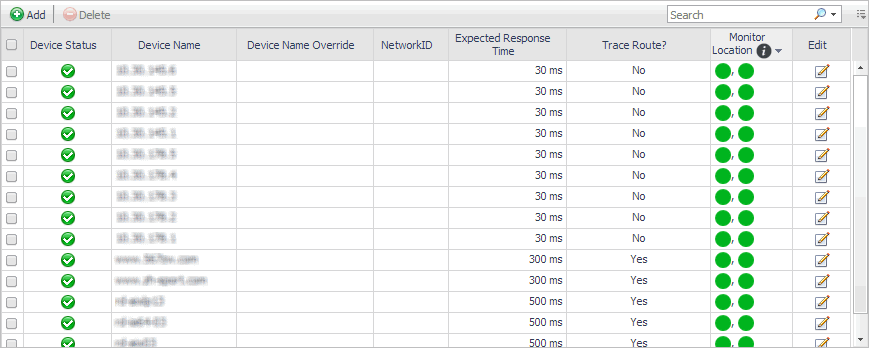
The Devices Management view displays the monitored network devices.

On the Devices Management dashboard, this view appears just above the Agent Alarms view.
|
|
|
• |
Device Status. The state of the highest severity alarm raised against the network device: Warning  , Critical  , or Fatal  . |
|
• |
Expected Response Time. The expected round-trip response time between the host on which the Net Monitor Agent is installed and the network device. |
|
• |
Monitor Location. A color-coded indicator of the data collection state for each location from which this network device is monitored. Green indicates Normal, yellow Warning, orange Critical, and red the Fatal state. |
|
• |
NetworkID. The ID of the private network to which the network device belongs, if applicable. |
|
• |
Trace Route?. Indicates if the route from the monitoring agent to the network device is traced. | |