Viewing Module Definition Statistics
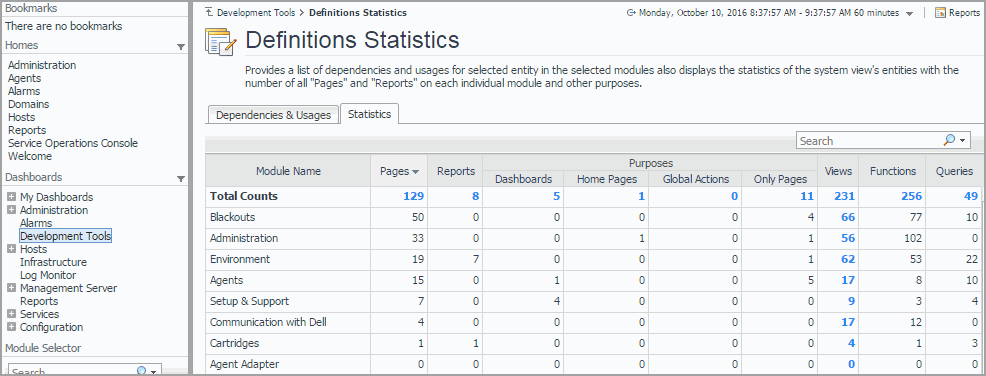
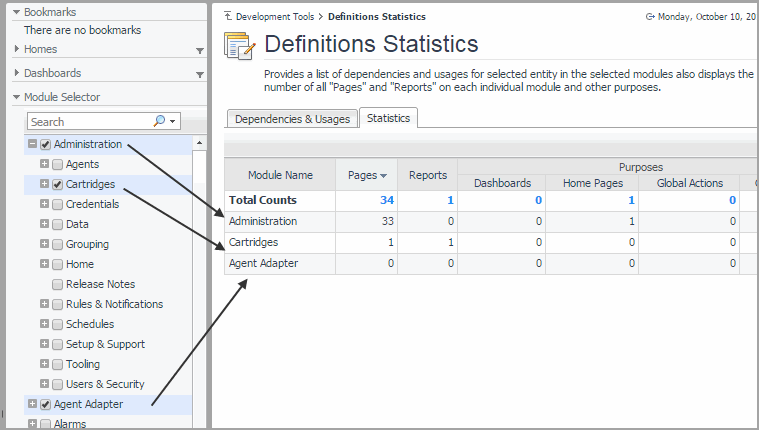
The Statistics tab on the Definition Statistics dashboard displays a summary of how views are used in individual modules or sub-modules.
|
1 |
On the Development Tools page, click Definitions Statistics. |
|
2 |
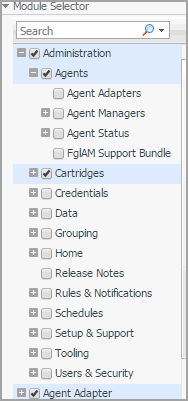
On the navigation panel, expand a node in the Module Selector. |
|
3 |
In the Module Selector, select all modules and sub-modules whose view definition statistics you want to see. |
|
5 |
To return to the Development Tools page, click Development Tools in the breadcrumb trail. |
Viewing and Managing Persistence Storage Usage
Getting Started
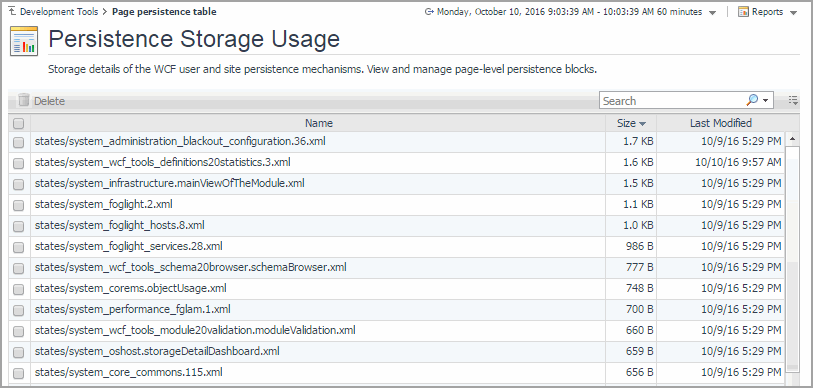
To access this dashboard, on the Development Tools page, click Persistence Storage Usage.
|
1 |
On the Development Tools page, click Persistence Storage Usage. |
|
4 |
To proceed, click Delete. |
|
5 |
To return to the Development Tools page, click Development Tools in the breadcrumb trail. |
Validating Data Sources
A data source contains information that is displayed in Foglight®. This information is stored in data objects as object properties. A data source encapsulates all the system knows about the collected data. It is organized as a dynamic graph of object types, starting from a root that represents the entire data model. The Data Source Validation dashboard allows you to select a data source and check if that data source has a root, and that the root type has properties defined. Detecting and solving data source problems early on can prevent problems in the browser interface. If any errors are found on the data source, they appear in the list. For each error, the list shows its type and the error description. The overall data source validation result also appears on the dashboard. Use this information to improve data source definitions as you develop. Warning messages usually appear for information purposes only, to indicate a non-fatal conditions. Unlike fatal messages, they do not prevent the data source from being validated.


