
Next Steps
|
1 |
Performance Monitoring — Start by assessing alarms on all storage devices. See Monitoring Storage Performance. |
|
2 |
Capacity Monitoring — After you acknowledge and/or resolve device-level alarms, you may want to investigate individual storage devices and their components. See Investigating Storage Devices. |
|
3 |
Connectivity and I/O Performance Monitoring — You can identify performance or connectivity problems that occur during I/O requests by viewing diagrams that place storage components within the context of the virtualization environment, from VMs and hosts to storage devices. See Assessing Connectivity and I/O Performance. |
Storage Administrators need to respond to reports about problems in the storage environment.
|
• |
Monitoring Storage Performance
This section covers the following topics:
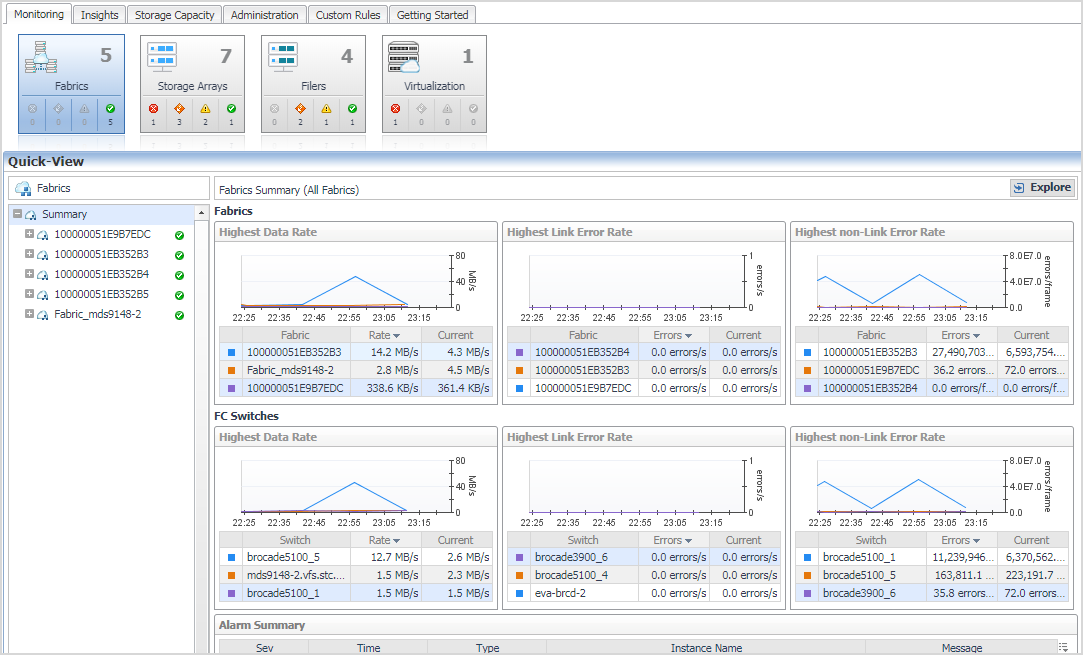
Introducing the Storage Environment Dashboard
|
• |
Monitoring Tab — Monitor your overall storage environment by device type. For more information, see Summary and Resource Information for each Collected Target:. |
|
• |
|
• |
|
• |
|
• |
|
• |
Storage Capacity tab — Monitor your storage capacity by device type. For more information, see Monitoring Storage Capacity. |
If your Foglight for Storage Management user account includes the Storage Administrator role, the Storage Environment dashboard also displays these tabs:
|
• |
Administration Tab — Manage configured agents, credentials, and modify data collection settings. |
|
• |
Getting Started Tab — Purchase a product license. |
|
• |
| |||
|
Contains four areas: Device List, Device Summary, FAQts, and Alarm Summary. | |||
|
Displays the list of storage devices that match the selected tile.
| |||
|
Displays performance and capacity metrics for the device selected in the Device List. | |||
|
Offers common searches in the form of questions. Scroll through questions, and click Show Me to see the answer to the currently displayed question. For more information, see Asking Questions About the Monitored Storage Environment. | |||
|
Displays a list of alarms for the device selected in the Device List. For more information, see Understanding Status, Alarms, and Rules in Foglight for Storage Management. |
|
1 |
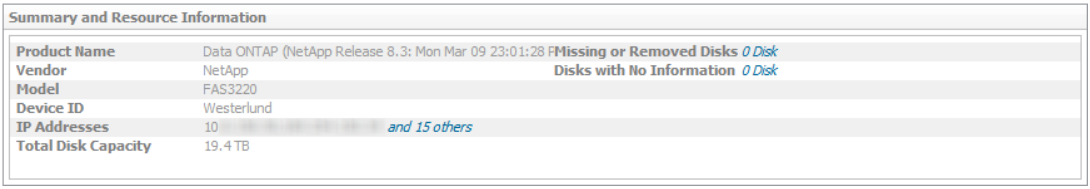
Open the navigation panel, under Dashboards, select a target type. Then, select a target and click Explore. |
|
• |
Product Name: Shows the target type name |
|
• |
Vendor: Shows vendor name |
|
• |
Model: Shows the model of the target |
|
• |
DeviceID: Shows the name of the target |
|
• |
IP Address: Shows the IP addresses of the target |
|
• |
Total Disk Capacity: Shows the total disk capacity of the target |
|
• |
Missing or Removed Disks: Shows the missing or Removed Disks, if any |
|
• |
Disks with no Information: Shows the disks reported as No Information, if any |
Monitoring Your Storage Environment
When you begin monitoring your storage environment, a good way to start is by identifying poorly-performing devices and resolving the issues that are contributing to the problems. In Foglight for Storage Management, all storage devices and their child components are assigned a status, which enables you to see at glance which elements in your storage infrastructure need attention. Any device that enters a non-Normal status triggers an alarm. For more information, see Understanding Status, Alarms, and Rules in Foglight for Storage Management.