Identifying top consumers
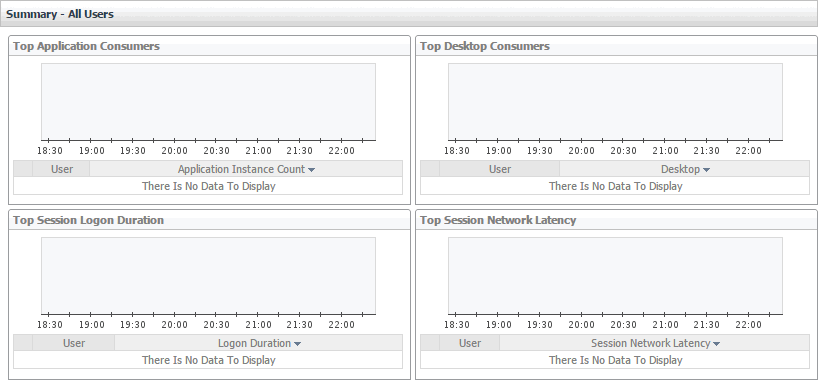
Your monitored XenDesktop environment delivers applications to end users on demand. The Summary - All Users view identifies the users with the highest applications and desktop usage, longest logon times, and highest network latencies. This view appears in the Quick View when you select All Users in the Users view on the left. Use it to look for potential bottlenecks in your system in order to prevent potential service disruptions by reallocating system resources where they are most needed.
Investigating the levels of resource consumption
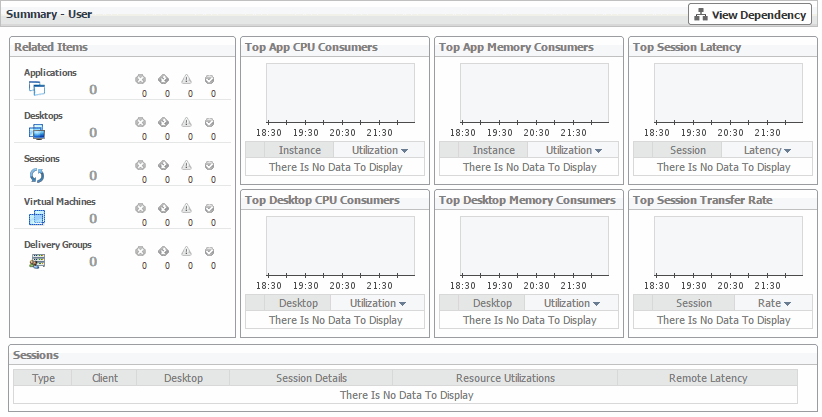
Your monitored XenDesktop® environment delivers virtual desktops and applications are delivered to end users on demand. You can review the levels of CPU and memory resources consumed by these elements, along with session-related metrics in the Summary - User view. Use it to identify the applications and desktops that consume the highest amounts of CPU and memory resources, and to look more closely at session latency and transfer rates. An application or desktop with consistently low CPU or memory utilization rates, for example, often calls for re-allocating these under used resources where they are more needed.
|
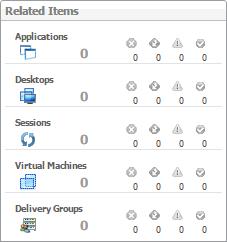
The objects that are associated with the selected user object and their alarm state. Figure 48. Related Items view
| |
|
Figure 49. Top App CPU Consumers view
| |
|
Figure 50. Top App Memory Consumers view
| |
|
Figure 51. Top Session Latency view
| |
Monitoring Delivery Groups
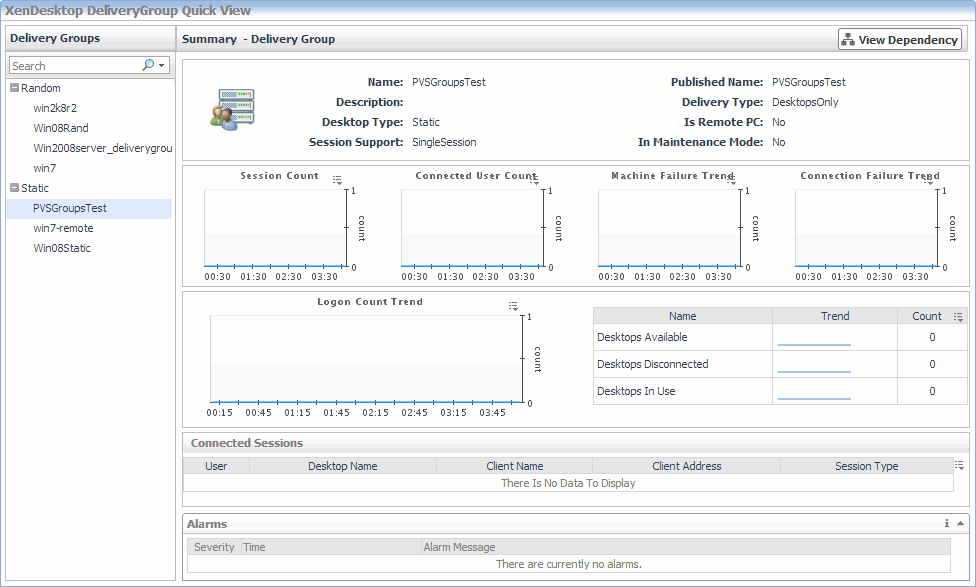
A Delivery Group specifies which users can access desktops or applications based on their user type. You can monitor the performance of Delivery Groups when you select the Delivery Groups tile on the XenDesktop Environment dashboard. The information appearing in the XenDesktop DeliveryGroup Quick View can help you discover sources of performance degradation such as high number of sessions or machine failures, and to reallocate resources where they are most needed.
|
1 |
|
2 |
|
3 |
In the XenDesktop DeliveryGroup Quick View, in the Delivery Groups view on the left, click a delivery group node. |
|
4 |
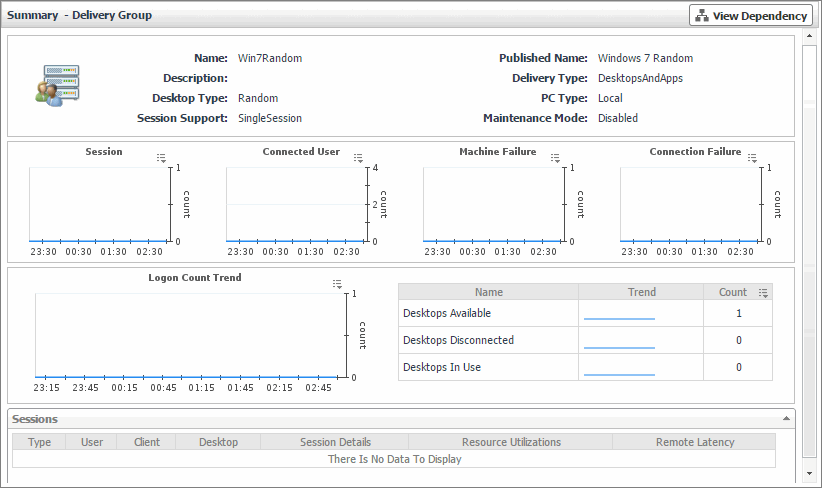
Investigating Delivery Group details
In your monitored environment, a Delivery Group is a collection of desktops and applications that can be accessed by specific end users. You can review the performance of individual Delivery Groups in the Summary - Delivery Group view. This view allows you to review general information about a selected delivery group along with performance trends in session counts, connected users, machine and connection failures. Use this view to review the general trends in the overall performance of monitored Delivery Groups and to look for any indicators that suggest potential bottlenecks. For example, an unusually high number of connection failures can affect the end-user experience and should be investigated.

