Monitoring your environment
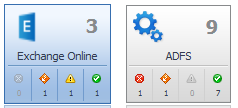
The Monitoring tab of the Office 365 Environment dashboard displays a summary of the Exchange Online services and the ADFS services (Active Directory® Federation Services) being monitored and their current state. It show performance and availability metrics provided by the Microsoft® Exchange online (SaaS).
This section includes the following topic:
Accessing the Monitoring tab
|
1 |
|
2 |
Click the Monitoring tab. |
Foglight for Office 365 Environment Overview
Foglight for Office 365 Environment Quick View
The Foglight for Office 365 Environment Quick View consists of the following embedded views:
In addition, in the top right corner of the Object Summary view there is an Explore button. Click this button to navigate to the Foglight for Office 365 Explorer dashboards, for more detailed metrics about the selected object or group of objects.
This functionality in this view will be available in a future release.
|
Displays the following information for the selected Exchange Online object. | |
|
Severity. The icon in this column indicates the severity of the alarm. | |
|
Time. Indicates the date and time when the alarm occur ed. | |
|
Origin. Indicated the cause of the alarm. | |
|
Instance. Displays the topology object instance name that triggered the alarm. | |
|
Alarm Message. Displays the alarm message. | |


