Account Summary view
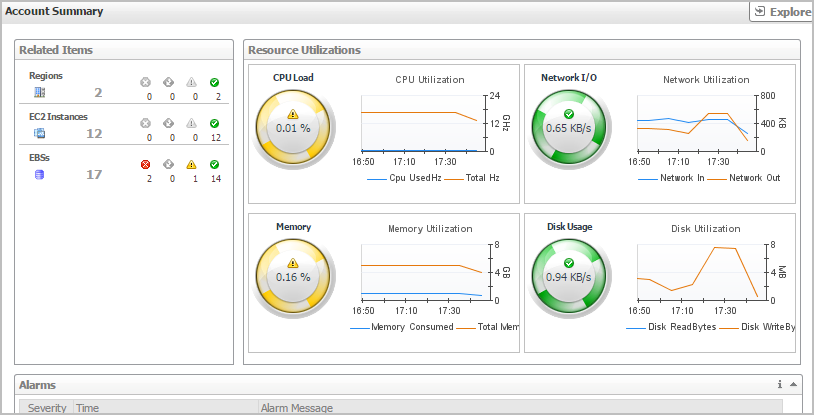
The Account Summary view shows the overall resource utilization and the amounts of system resource consumption for an account. This view appears on the right when you select a virtual machine in the Accounts view.
This view consists of the following embedded views:
|
|
Shows the numbers and states of the selected account running on the monitored AWS environment. |
|
|
|
• |
Disk Usage. Indicates total Disk Usage throughput across all EC2 Instances monitored by the Region. | |
|
|
|
• |
Network I/O. Indicates total network throughput across all EC2 Instances monitored by the Region. | |
|
|
|
• |
CPU Load. Shows the average CPU Load on all EC2 Instances for the Region based on the total capacity. | |
|
|
|
• |
Memory. Shows the Memory Utilization summary for the specified Region based on the total capacity. | |
|
|
Drill down on: |
|
|
|
• |
CPU Load. Displays the CPU Load dialog box, including CPU Utilization and Baseline. | |
|
|
|
• |
Memory. Displays the Memory Usage dialog box, including Memory Utilization and Baseline. | |
|
|
|
• |
Network I/O. Displays the Network I/O view, showing the metrics of network Usage (in bps) and Baseline. | |
|
|
|
• |
Disk Usage. Display the Disk Usage view, showing the metrics of disk Usage and Baseline. | |
|
|
Shows the resource consumption for the selected account, broken down into three simple views. |
|
|
|
• |
EC2 Instances. The number of the ECS2 instances that are associated with the selected account, followed by related alarm counts, broken down by the alarm state (Normal, Warning, Critical, Fatal). | |
|
|
|
• |
EBSs. The number of the EBSs that are associated with the selected account, followed by related alarm counts, broken down by the alarm state (Normal, Warning, Critical, Fatal). | |
|
|
|
• |
Regions. The number of the regions that are that are associated with the selected account, followed by related alarm counts, broken down by the alarm state (Normal, Warning, Critical, Fatal). | |
|
|
Drill down on: |
|
|
|
• |
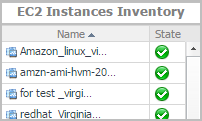
EC2 Instances. Displays the EC2 Instances Inventory dwell, showing the name and state of the associated Resource Groups. |
|
|
|
|
• |
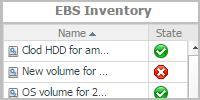
EBSs. Displays the EBS Inventory dwell, showing the name and state of the associated virtual machine. |
|
|
|
|
• |
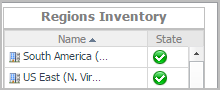
Regions. Displays the Regions Inventory dwell, showing the name and state of the associated accounts. |
|
EC2 Instances Monitoring
The EC2 Instances view shows the data collected about a specific EC2 instance or all EC2 instances. For more information, see the following topics:
EC2 Instances view
The EC2 Instances tree view lists the EC2 instances existing in your AWS environment and shows their state. This view appears on the left when you select the EC2 Instances tile in the Actions bar.
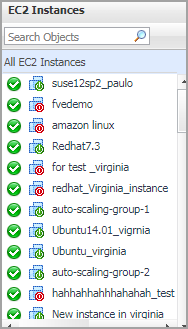
Selecting the All EC2 Instances node displays all EC2 instances in the Summary - All EC2 Instances view on the right. Similarly, selecting an EC2 instance shows EC2 instance-specific metrics in the EC2 Instance Summary view on the right.
Summary - All EC2 Instances view
The Summary - All EC2 Instances view displays overall EC2 instance information. This view appears on the right when you select All EC2 Instances in the EC2 Instances view.
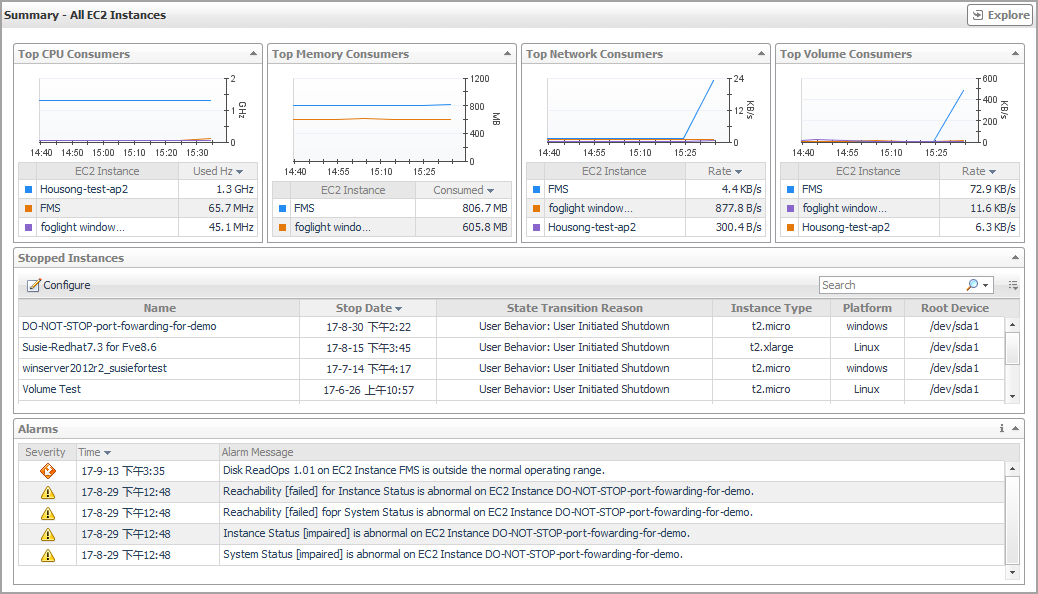
This view consists of the following embedded views: