立即与支持人员聊天
与支持团队交流

Foglight Capacity Management 5.7.7 - User Guide

Excluded Hosts

The Excluded Hosts view show in tabular form those hosts that did not provide sufficient data to contribute to the capacity management graphs created.

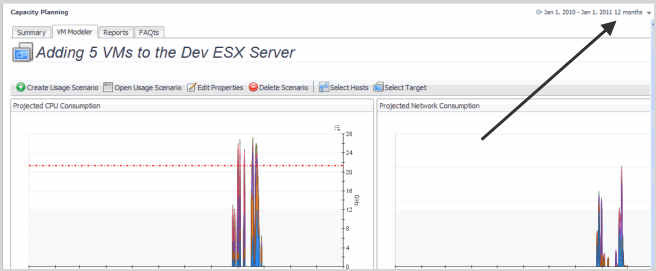
The default time range setting is four hours. When only looking at the last four hours, the server may appear to have enough CPU, memory, network, or disk resources to accommodate your new host(s). Looking at a longer time frame may reveal that the current hosts consume large quantities of resources at specific times. They may run during the weekend and the addition of hosts during those periods would negatively impact the server. Prior to moving a host to a new server, it is recommended to look at a longer historical timeframe to get a broader view of the server's resource availability. If you end up with a large list of excluded hosts, or VMs with insufficient data, experiment with shorter time intervals.

Timeline—allows you to set a fixed time range or use a zonar to select a specific time range.
Calendar—allows you to select a specific date range.

Using Capacity Management Charts

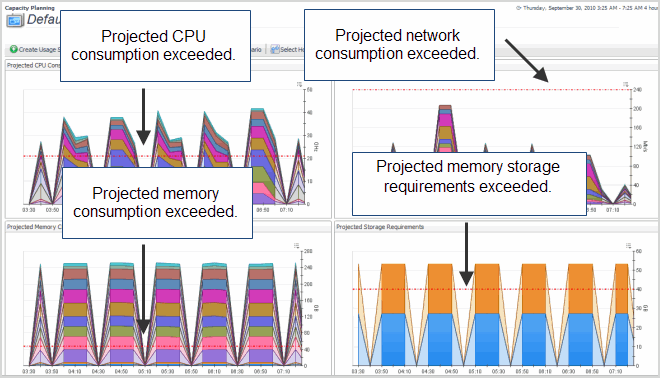
After creating capacity management scenarios, the charts show the potential impact of moving the selected hosts to a particular server. The red dotted threshold lines show if the a projected capacity has been exceeded. If any of the charts (CPU, memory, network, storage) climb above these threshold lines, the selected server may not be a good candidate to receive these hosts. The server will not have enough spare resources to accommodate the requirements. The following graphic shows how capacity management planning helps prepare for the impact of adding hosts to a server machine for the time range selected.

Changing Chart Types

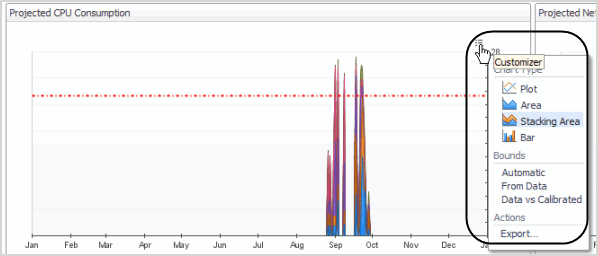
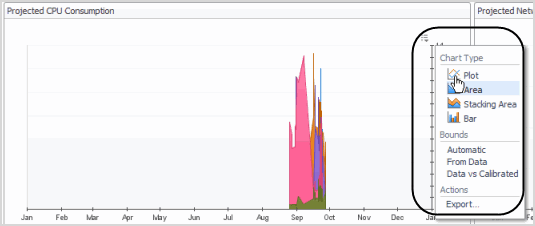
Cartridge for Capacity Management charts allow you to change chart types and export capacity management data and graphics by clicking the Customizer list in the upper-right corner of each chart view.

From this drop-down, you can:

Change Chart Types

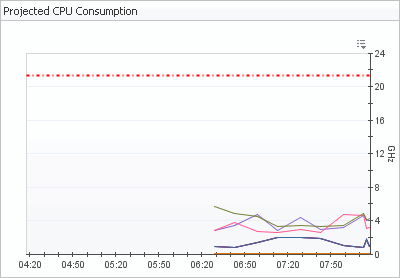
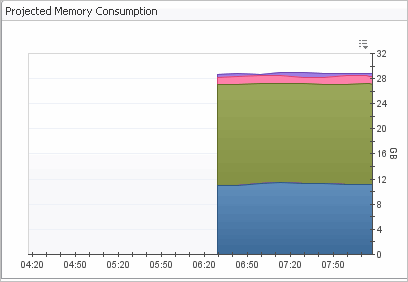
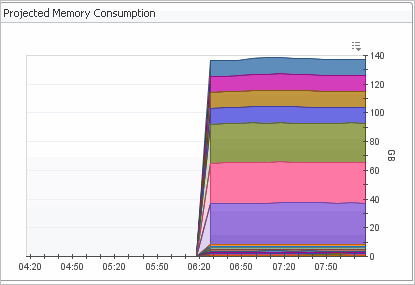
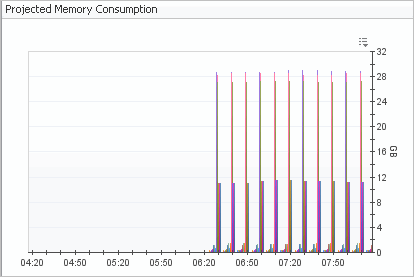
Changing chart types allows you to closely and accurately analyze capacity management results. The following chart types are provided:

Figure 41. Plot

Figure 42. Area

Figure 43. Stacking Area

Figure 44. Bar

In the upper-right corner of any chart, click the Customizer list and select the required chart type.
相关文档

The document was helpful.

选择评级

I easily found the information I needed.

选择评级