立即与支持人员聊天
与支持团队交流

Foglight 5.9.4 - Administration and Configuration Guide

Administering and Configuring Foglight Extending Your Monitoring Reach with Foglight Cartridges Administering Foglight Configure Rules and Metric Calculations to Discover Bottlenecks Customizing Your Foglight Environment with Tooling

Online-Only Topics

Learn more about:

Manage Rules

This dashboard is a starting point for viewing and customizing Foglight rules. It displays a list of all multiple-severity that exist in your environment, including the rules that come with the Management Server and any installed cartridges.

By default, the following columns are displayed:

Rule state: Indicates if the rule is enabled or disabled . You can sort the list of rules by state, by clicking the State icon.
Rule: Contains the rule name.
Copy: Creates a copy of the selected rule.
Disable (enabled rules only): Disables an enabled rule.
Enable (disabled rules only): Enables a disabled rule.
View and edit: Starts the workflow for viewing and editing rule details.
Other: Contains the value of any registry variables referenced by rule severity variables.
Alarms: Contains the number of alarms (multiple-severity rules only) generated by the rule. Clicking that column shows a list of alarms indicating for each alarm its severity, when the alarm was generated, and the alarm message.
Description: Contains the rule description.

The above columns appear by default. Click the Customizer to select the following columns for display:

Rulettes: The number of scoped objects to which the rule is bound. A rulette is a rule instance that represents the state of the monitoring object to which the rule condition applies. Clicking this column shows a list of all scoped objects.
Last Reset: The date and time of the most recent reset of the object’s state.
Triggers: The total number of times that the rule conditions evaluated the object instance.
Fired: The total number of times that the rule changed the state.
Hit: The total number of times that the rule conditions evaluated to True.
Miss: The total number of times that the rule conditions evaluated to False.
Last Fired: The most recent date and time when the rule changed the state.
Last Miss: The most recent date and time when a rule condition evaluated to False.
Cartridge: The name of the cartridge in which the rule is defined, including the cartridges included with the server, and any installed cartridges. This column is empty for rules that you create.
Cartridge Version: The version of the cartridge in which the rule is defined, including cartridges included with the server, and any installed cartridges. This column is empty for those rules that you create.
Last Modified Date: The date on which the rule was last modified.
Scope: This can give you a better idea on the effect that the rule has on your monitored system. The scope identifies one or more topology objects that the rule evaluates. If the scope is not defined, the rule runs against the entire data set, which can have a negative effect on overall performance. A rule can be scoped to a topology type and can optionally be scoped to specific topology objects of that type. For more information, see Rule scope.
Object Name: The name of the scoped object instance.
Unique ID: The ID of the scoped object instance.
Aggregate State: The state of the scoped object instance, representing the highest severity alarm state generated against this instance: Normal, Warning, Critical, or Fatal.
Type Name: The name of the topology type that the object is an instance of.

Use the Enable and Disable buttons in the top-left to enable or disable selected rules.

To filter the list of rules by cartridge, click Cartridge in the top left and select a cartridge from the list that appears.

To access the Manage Rules dashboard, click Old Manage Rules. Use this dashboard to access an extended set of rule management tasks that cannot be initiated from the Rule Management dashboard, such as editing rule permissions, and suspending or resuming rule actions.

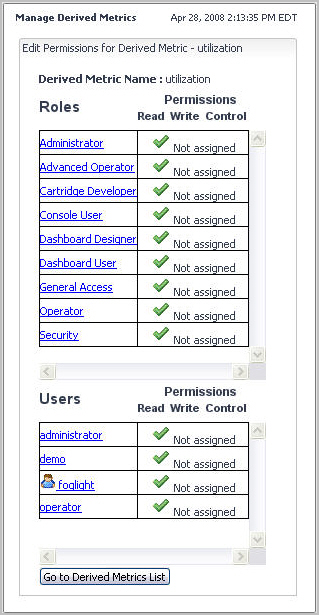
Foglight has a way to to control access to different entities, including rules. While it is possible to use permissions to control access to rules, this feature is deprecated and should not be used.

Copying a rule is useful in situations when you need to quickly create a modified version of an existing rule. If you need to edit an existing rule, it is considered good practice to copy the rule, disable the original rule, then make your modifications. This makes it possible to refer back to the original rule definition, or re-enable it after disabling the modified version, if necessary.

Rules can be copied using either the Rule Management dashboard, or the Manage Rules dashboard. Rules can be deleted using the Manage Rules dashboard.

1
On the navigation panel, under Dashboards, choose Administration > Rules & Notifications > Rules.
3
In the Copy dialog box, specify the new rule name (optional, a default name already appears), indicate if you want to disable the original rule (default setting) or not, and indicate if you want to enable the new rule (default setting) or not.
4
5
Use the Edit Rule page to view and edit the rule definitions, as required. For more information, see Edit rule definitions.
1
On the navigation panel, under Dashboards, choose Administration > Rules & Notifications > Rules.
4
In the Rule Confirmation dialog box, click OK.
The Rule Confirmation dialog box closes and the Edit Rule area appears in the Manage Rules dashboard, so that you can edit the newly-copied rule.
1
On the navigation panel, under Dashboards, choose Administration > Rules & Notifications > Rules.
4
Click Delete Selected.
5
In the Delete Rule Confirmation dialog box, click OK.
The Delete Rule Confirmation dialog box closes.

In some cases, you may need to enable or disable a rule. For example, if a rule monitors a host that needs to taken offline for system maintenance, you can disable that rule temporarily to avoid triggering its actions while the monitored host is unavailable. In most cases this is done using blackouts, however in some circumstances it may be better to disable the rule completely.

Rules can be enabled and disabled using the Rule Management or the Manage Rules dashboard.

1
On the navigation panel, under Dashboards, choose Administration > Rules & Notifications > Rules.
3
In the Disable Rules dialog box, click Yes.
The Disable Rules dialog box closes and the Rules dashboard refreshes, showing the Disabled icon () in the row containing the newly disabled rule.
1
On the navigation panel, under Dashboards, choose Administration > Rules & Notifications > Rules.
4
Click the Disable Rules button at the bottom.
5
In Delete Rule Confirmation dialog box, click OK.
The Delete Rule Confirmation dialog box closes and the Manage Rules dashboard refreshes, showing a Rule is currently disabled icon () in the row containing the newly disabled rule.
1
On the navigation panel, under Dashboards, choose Administration > Rules & Notifications > Rules.
3
In the Enable Rules dialog box, click Yes.
The Enable Rules dialog box closes and the Rule Management dashboard refreshes, showing the Enabled icon () in the row containing the newly-disabled rule.
1
On the navigation panel, under Dashboards, choose Administration > Rules & Notifications > Rules.
NOTE: Some browser versions do not support the nested rendering of the Edit Rule page that you are about to access. If you are using those browser versions, click Launch in the display area, as prompted, to open the Edit Rule page in a new window or tab.
4
Click the Enable Rules button at the bottom.
5
In Delete Rule Confirmation dialog box, click OK.
The Delete Rule Confirmation dialog box closes and the Manage Rules dashboard refreshes, no longer showing the Rule is currently disabled icon () in the row containing the newly-enabled rule.

You can configure a rule to stop generating alarms for a specified length of time (beginning immediately). It can be useful to suspend alarms in many situations, such as when one or more servers are being brought offline for system maintenance. Rule alarms can be suspended or resumed using the Manage Rules dashboard.

1
On the navigation panel, under Dashboards, choose Administration > Rules & Notifications > Rules.
NOTE: Some browser versions do not support the nested rendering of the Edit Rule page that you are about to access. If you are using those browser versions, click Launch in the display area, as prompted, to open the Edit Rule page in a new window or tab.
4
Click the Suspend Alarms button at the bottom.
5
In the Temporarily Suspend Rule Alarms dialog box, specify the time period for which you want to suspend alarms.
In the Temporarily Suspend Rule Alarms dialog box, click For and select the time period as required, then click Go.
The Temporarily Suspend Rule Alarms dialog box closes and the Manage Rules dashboard refreshes, showing a warning icon in the row containing the rule with newly-suspended alarms.
1
On the navigation panel, under Dashboards, choose Administration > Rules & Notifications > Rules.
NOTE: Some browser versions do not support the nested rendering of the Edit Rule page that you are about to access. If you are using those browser versions, click Launch in the display area, as prompted, to open the Edit Rule page in a new window or tab.
4
Click Resume Alarms.
5
In the Rule Confirmation dialog box, click OK.
The Rule Confirmation dialog box closes and the Manage Rules dashboard refreshes.

You can configure a rule to stop performing actions for a specified length of time (beginning immediately). It can be useful to suspend alarms in many situations, such as when one or more servers are being brought offline for system maintenance. Rule actions can be suspended or resumed using the Manage Rules dashboard.

1
On the navigation panel, under Dashboards, choose Administration > Rules & Notifications > Rules.
NOTE: Some browser versions do not support the nested rendering of the Edit Rule page that you are about to access. If you are using those browser versions, click Launch in the display area, as prompted, to open the Edit Rule page in a new window or tab.
4
Click Suspend Actions.
5
In the Temporarily Suspend Rule Actions dialog box, specify the time period for which you want to suspend actions.
In the Temporarily Suspend Rule Actions dialog box, click For and select the time period as required, then click Go.
The Temporarily Suspend Rule Actions dialog box closes and the Manage Rules dashboard refreshes, showing a warning icon in the row containing the rule with newly-suspended actions.
1
On the navigation panel, under Dashboards, choose Administration > Rules & Notifications > Rules.
NOTE: Some browser versions do not support the nested rendering of the Edit Rule page that you are about to access. If you are using those browser versions, click Launch in the display area, as prompted, to open the Edit Rule page in a new window or tab.
4
Click the Resume Actions button at the bottom.
5
In the Rule Confirmation dialog box, click OK.
The Rule Confirmation dialog box closes and the Manage Rules dashboard refreshes.

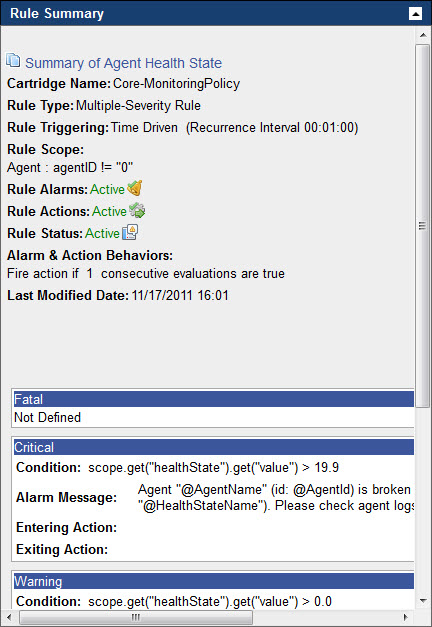
The Edit Rule view includes a summary pane that allows you to quickly review a rule’s settings and drill down to the appropriate tab if required. Rule summaries can be accessed using the old Manage Rules dashboard.

The Rule Summary pane includes the following information:

1
On the navigation panel, under Dashboards, choose Administration > Rules & Notifications > Rules.
NOTE: Some browser versions do not support the nested rendering of the Edit Rule page that you are about to access. If you are using those browser versions, click Launch in the display area, as prompted, to open the Edit Rule page in a new window or tab.
3
On the Manage Rules dashboard that appears, click the Rule Name column of the row containing the rule whose summary you want to view.
The Edit Rule view appears in the display area.
4
Open the Rule Summary pane by clicking Roll Down () on the Rule Summary bar.
NOTE: The appearance of the Rule Summary pane depends on the rule type, its severity levels, and other settings. In the above illustration, the rule whose settings appear in the Rule Summary pane is active.
The Rule Summary pane includes links to other areas in the Edit Rule view and Manage Rules dashboard that allow you to quickly edit the rule settings.
For example, move the mouse pointer over Rule Triggering in the Rule Summary pane. A tool tip appears, with the text: Edit Trigger Type.

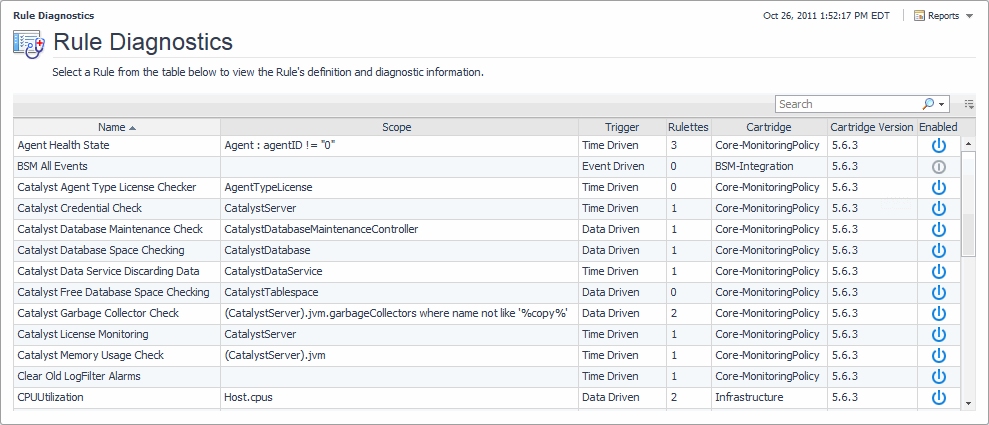
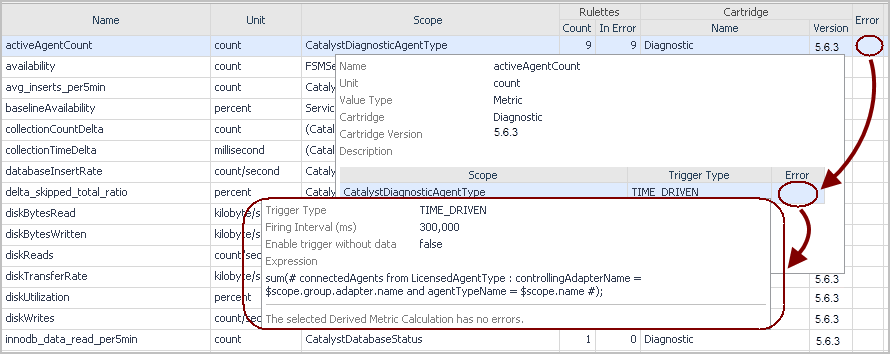
The Rule Diagnostics dashboard lists all rules that exist in your environment, including the rules available with the server and any installed cartridges. Use this dashboard to better understand how the existing rules are operating and to debug any rule-related problems.

For each rule, the Rule Diagnostics dashboard shows the following information:

Name: The rule name.
Scope: The rule scope. This can give you a better idea on the effect the rule has on your monitored system. The scope identifies one or more topology objects that the rule evaluates. If the scope is not defined, the rule runs against the entire data set which can have a negative effect on overall performance. A rule can be scoped to a topology type and can optionally be scoped to specific topology objects of that type. For more information, see Rule scope.
Trigger: The trigger type. This value affects the frequency at which the rule conditions are evaluated. The rule trigger gives you a general idea of the rule activity and the alarms it generates. For example, a default data-driven trigger causes the rule conditions to be evaluated every time the data associated with the rule is collected and higher data sampling frequencies result in a higher number of alarms being generated. For more information, see Rule triggers.
Rulettes: The number of scoped objects to which the rule is bound. A rulette is a rule instance that represents the state of the monitoring object to which the rule condition applies.
Cartridge: The name of the cartridge in which the rule is defined, including the cartridges included with the server, and any installed cartridges. This column is empty for those rules that you create.
Cartridge Version: The version of the cartridge in which the rule is defined, including cartridges included with the server, and any installed cartridges. This column is empty for those rules that you create.
Enabled: Indicates if a rule is enabled or disabled. When a rule is disabled, its conditions are not being evaluated which prevents the rule alarms from being generated. For example, if Foglight is collecting any data that, under normal circumstances, result in alarm generation. Failing to generate alarms can be an indication that the rule is disabled. Rules are often brought offline during system maintenance periods.

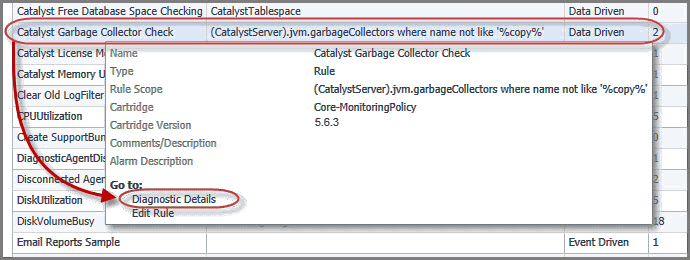
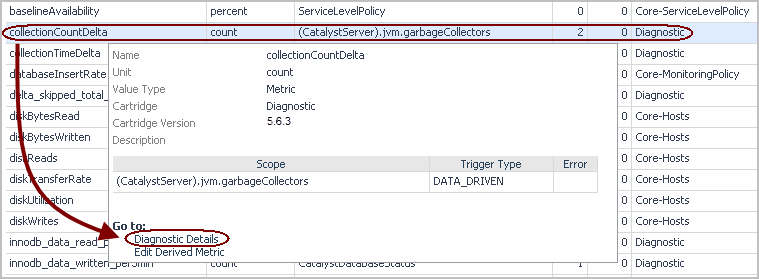
From here, you can drill down to a rule to see additional diagnostics about that rule. To do that, click the row containing the specific rule and, in the dwell that appears, under Go to, click Diagnostic Details.

For more information about the Diagnostic Details view that appears, see View diagnostic details for a rule.

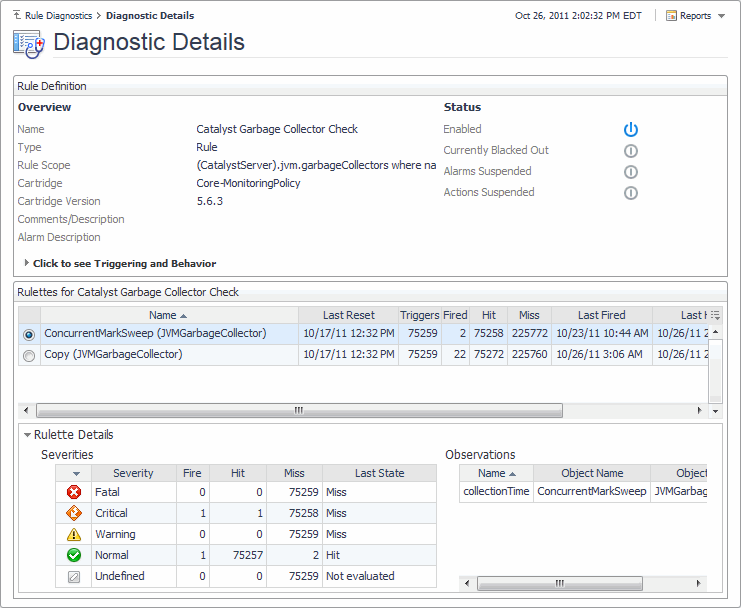
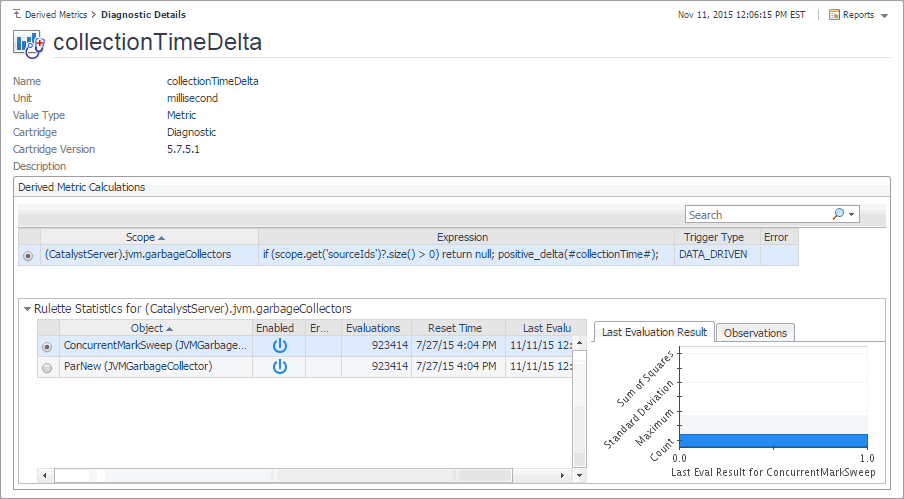
The Diagnostic Details view contains detailed run-time information about a selected rule. Use this view to determine which objects are evaluated by the rule and as a debugging tool to help you understand any rule-related problems. Drill down to this view from the Rule Diagnostics dashboard.

This composite view contains the following embedded views:

Shows rule definitions.

Name. The rule name.
Type. A rule type can be either simple or multiple-severity. A simple rule has a single condition, and when that condition evaluates to True, the rule enters the Fire state. Multiple-severity rules are more complex in that they can have multiple conditions and multiple the severity levels, including Warning, Critical, and Fatal. For more information, see Rule types.
Rule Scope. The rule scope. This can give you a better idea on the effect the rule has on your monitored system. The scope identifies one or more topology objects that the rule evaluates. If the scope is not defined, the rule runs against the entire data set which can have a negative effect on overall performance. A rule can be scoped to a topology type and can optionally be scoped to specific topology objects of that type. For more information, see Rule scope.
Cartridge. The name of the cartridge in which the rule is defined, including the cartridges included with the server, and any installed cartridges. This column is empty for those rules that you create.
Cartridge Version. The version of the cartridge in which the rule is defined, including cartridges included with the server, and any installed cartridges. This column is empty for those rules that you create.
Comments/Description. Comments or notes associated with the rule.
Alarm Description. Description of the alarm message.
Enabled. Indicates if a rule is enabled or disabled. When a rule is disabled, its conditions are not being evaluated which prevents the rule alarms from being generated. For example, if Foglight is collecting any data that, under normal circumstances, result in alarm generation. Failing to generate alarms can be an indication that the rule is disabled. Rules are often brought offline during system maintenance periods.
Blackout. Indicates if there are any blackouts in place that affect the rule’s actions.
Alarms. Indicates if the rule alarms are enabled or disabled. When rule alarms are suspended, the rule continues to evaluate the collected data but does not generate alarms when its conditions are met. For more information, see Suspending or resuming rule alarms.
Actions. Indicates if the rule actions are enabled or disabled. When rule actions are suspended, the rule continues to evaluate the collected data but does not generate actions when its conditions are met. For more information, see Suspending or resuming rule actions.
Trigger Type. The trigger type. This value affects the frequency at which the rule conditions are evaluated. The rule trigger gives you a general idea of the rule activity and the alarms it generates. For example, a default data-driven trigger causes the rule conditions to be evaluated every time the data associated with the rule is collected and higher data sampling frequencies result in a higher number of alarms being generated. For more information, see Rule triggers.

Lists one or more object instances to which the rule is bound, and shows information about the rule activity, as it relates to each object instance. Selecting a table row shows additional statistics about the rule activity in the Rulette Details View.

Long Name. The name of the object instance evaluated by the rule and its data type.
Last Reset. The date and time of the most recent reset of the object’s state.
Triggers. The total number of times the rule conditions evaluated the object instance.
Fired. The total number of times the rule changed the state.
Hit. The total number of times the rule conditions evaluated to True.
Miss. The total number of times the rule conditions evaluated to False.
Last Fired. The most recent date and time the rule changed the state.
Last Hit. The most recent date and time a rule condition evaluated to True.
Last Miss. The most recent date and time a rule condition evaluated to False.

For the object instance selected in Rulettes for Rule View, this view shows detailed statistics about the rule execution, broken into severity levels.

Severity. The severity level associated with the condition that was evaluated against the selected object instance.
Fire. The total number of times the rule entered the severity level.
Hit. The total number of times the condition associated with this severity level evaluated to True.
Miss. The total number of times the condition associated with this severity level evaluated to False, or were not evaluated. If a condition is not defined for a severity level, it is not evaluated.
Last State. The result of the most recent severity-specific condition evaluation. It can have one of the following values:
Hit: The condition evaluated to True.
Miss: The condition evaluated to False.
Not evaluated: The condition was not evaluated. If a condition is not defined for a severity level, it is not evaluated.
Name. The name of the metric evaluated.
Object Name. The name of the object instance to which the rule is bound.
Object Type. The type of the object instance to which the rule is bound.
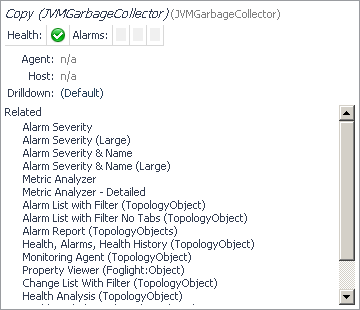
Drill down on an entry in the Observations table. Displays a dwell that shows the health of the object instance the metric is associated with, identifies any agents or hosts related to this instance, and lists links to views that reference the object instance, including the Property Viewer and Metric Analyzer. From here, clicking a link under Related drills down to the selected view.

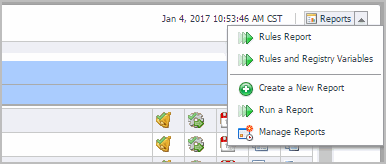
Some Foglight dashboards have reports associated with them. This allows you to run a report based on the current dashboard. You can generate the report using the Reports menu in the top-right corner.

The Rule Management dashboard is associated with the Rules Report. Run this report by choosing Rules Report from the Reports menu, and specifying the input parameters in the report wizard.

The report wizard provides more information about the Rules Report and instructions on how to set the input values. For more information about reports in Foglight, see the Foglight User Help.

Some Foglight dashboards have reports associated with them. This allows you to run a report based on the current dashboard. You can generate the report using the Reports menu in the top-right corner.

The Rule Diagnostics dashboard is associated with the Rules and Registry Variables Report. Run this report by choosing Rules and Registry Variables Report from the Reports menu, and specifying the input parameters in the report wizard.

The report wizard provides more information about the Rules and Registry Variables Report and instructions on how to set the input values. For more information about reports in Foglight, see the Foglight User Help.

Foglight uses flexible rules to apply your business logic to complex, interrelated data from multiple sources within your distributed system. A rule is a piece of business logic that links a condition with a result. It includes a scope and one or more conditional expressions, alarm messages, and actions.

A typical installation can include a large number of rules. You can create and manage multiple-severity rules using the Rule Management dashboard. The Rule Management dashboard lists the rules that exist in your environment and allows you to manage them.

Use this dashboard to drilldown on a rule and to view and edit its definitions. When you edit existing rules allows you can customize how Foglight notifies you of the status of desired metrics and specify what actions should be performed when their status changes.

1
On the navigation panel, under Dashboards, choose Administration > Rules & Notifications > Rules.
2
On the Rules dashboard, click the Rule column of the row containing the rule whose definitions you want to view or edit.
Management Server rules only. If the rule is defined in a cartridge that is comes included with the Management Server, the Confirm Edit Core Rule dialog box opens.
In the Copy dialog box, specify the new rule name (optional, a default name already appears), and indicate if you want to disable the original rule (default setting). Click OK.
NOTE: Some browser versions do not support the nested rendering of the Edit Rule page that you are about to access. If you are using those browser versions, click Launch in the display area, as prompted, to open the Edit Rule page in a new window or tab.
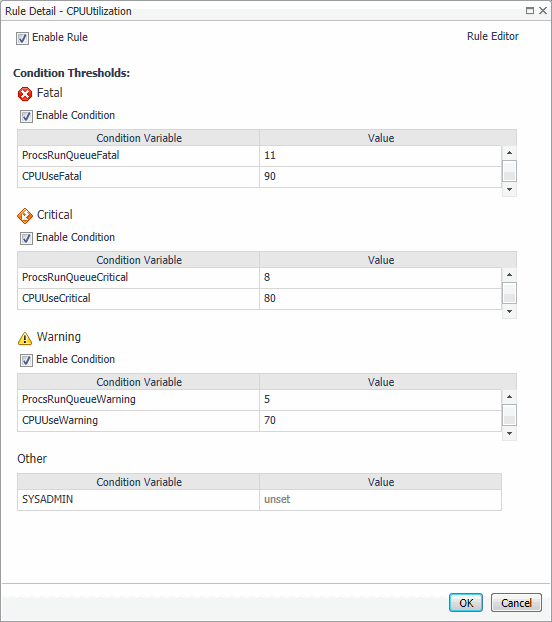
The Rule Detail dialog box lists the registry and severity-level variables that are referenced in the conditional expressions of the rule.
4
In the Rule Detail dialog box, in the upper-right corner, click Rule Editor.
NOTE: Some browser versions do not support the nested rendering of the Edit Rule page that you are about to access. If you are using those browser versions, click Launch in the display area, as prompted, to open the Edit Rule page in a new window or tab.
5
Use the Edit Rule page to view and edit the rule definitions, as required. For more information, see Edit rule definitions.

Foglight uses flexible rules to apply your business logic to complex, interrelated data from multiple sources within your distributed system. A rule is a piece of business logic that links a condition with a result. It includes a scope and one or more conditional expressions, alarm messages, and actions.

Many rules come included with Foglight and installed cartridges, including Agent Health State, BSM All Events, Catalyst Data Service Discarding Data, and many others. If the existing rules do not meet your needs, you can create a new one and add it to the rule collection.

By creating new rules or editing existing ones, you affect how Foglight notifies you of the status of desired metrics and specify what actions should be performed when their status changes.

1
Open the Create Rule dashboard. On the navigation panel, under Dashboards, choose Administration > Rules & Notifications > Create Rule.

Rule definitions specify the time at which they are evaluated, their complexity, and in some cases, the topology objects they evaluate. Rule definitions can be divided into the following categories:

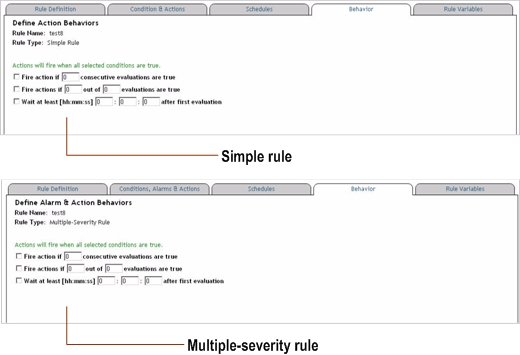
There are two types of rules in Foglight. Those types are Simple rules and Multiple-severity rules.

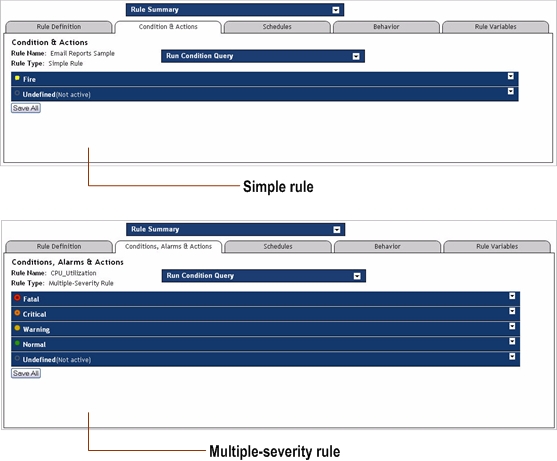
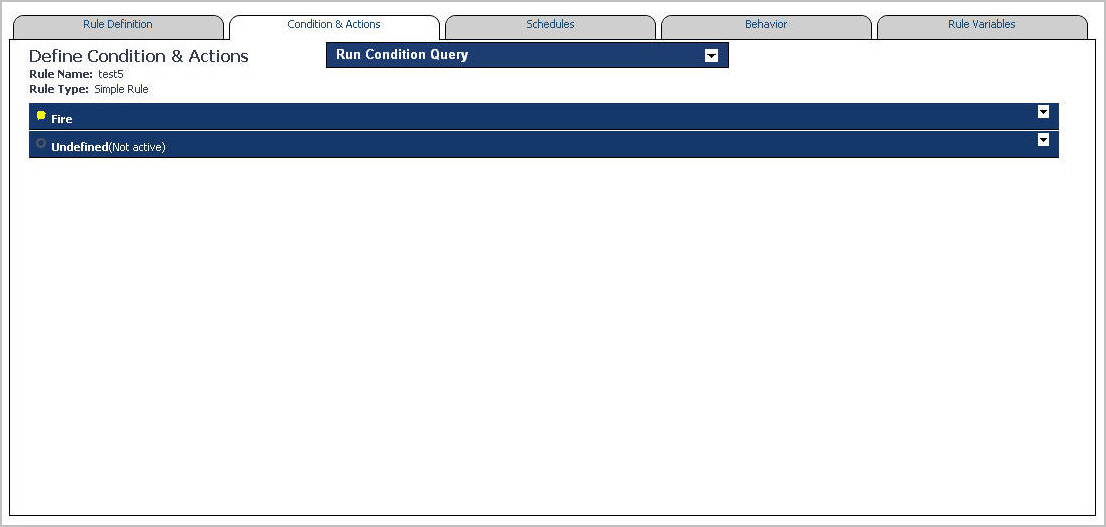
A simple rule has a single condition, and can be in one of three states:

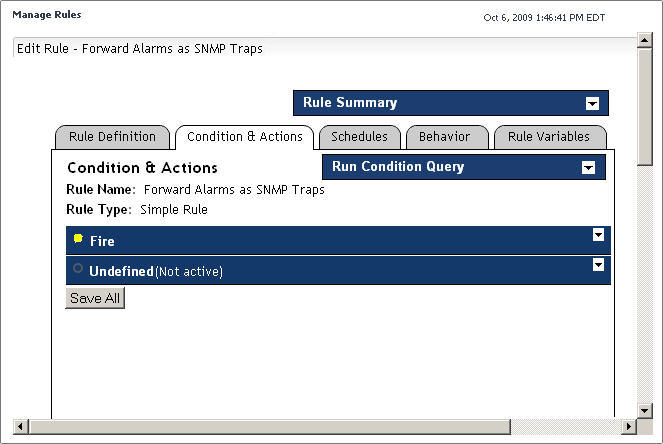
If its condition is met, the state of the rule is set to Fire and any actions that are associated with this state are performed. If the condition is not met, the rule remains in the Normal state. If the rule’s condition cannot be evaluated because data is missing or unavailable, the state of the rule is set to Undefined and any actions that are associated with this state are performed.

The condition for a simple rule is regularly evaluated against monitoring data. Therefore, the state of the rule can change if the data changes. For example, if the collected data matches a simple rule’s condition, the rule enters the Fire state. If the next set does not match the condition, the rule exits the Fire state and enters the Normal state. You can configure a simple rule to perform one or more actions upon entering and/or exiting each state.

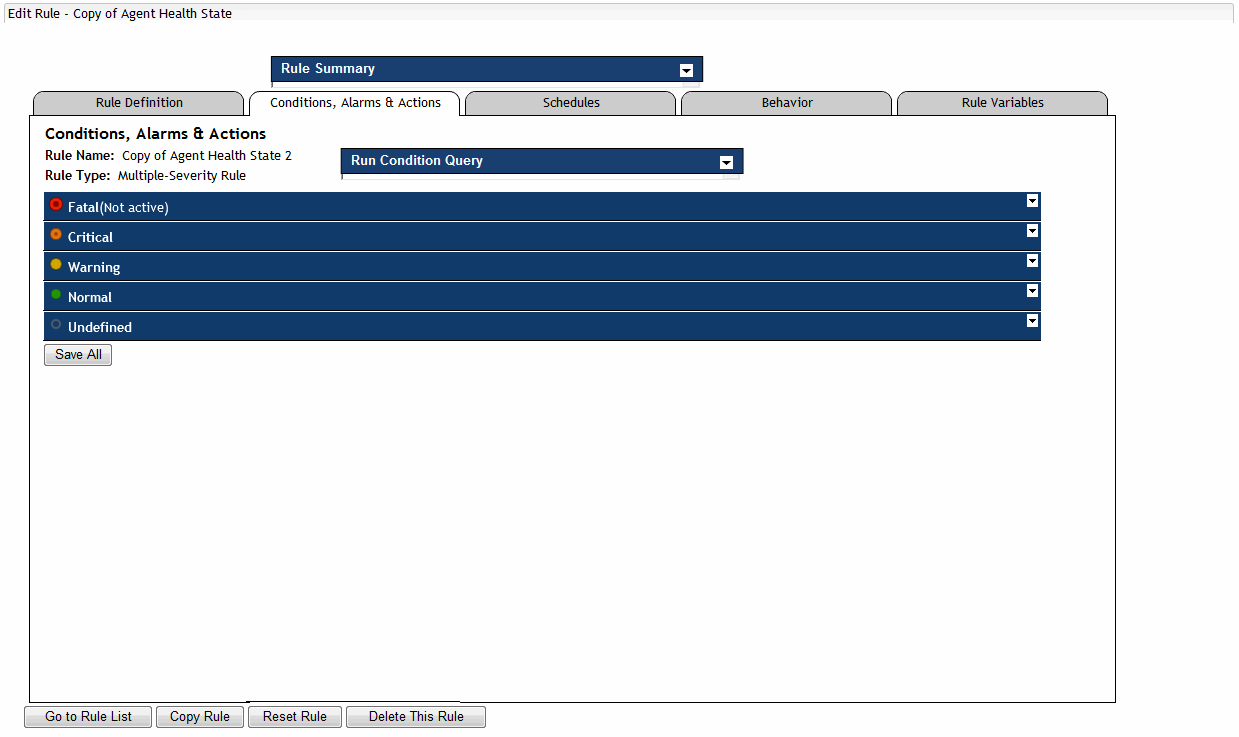
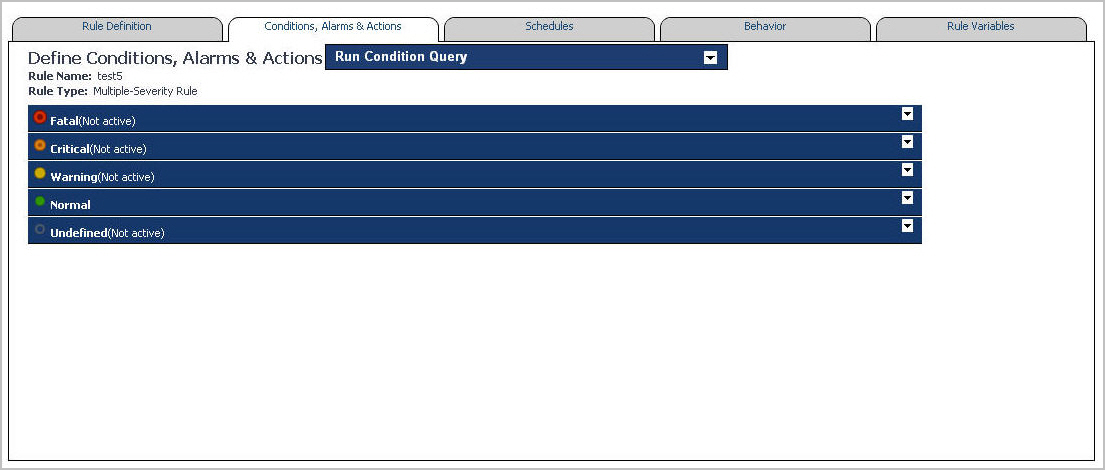
A multiple-severity rule is a more complex type of rule that can have up to five severity levels:

When you create a multiple-severity rule, you must specify a condition for at least one severity level (Fatal, Critical, or Warning).

As with simple rules, the conditions for a multiple-severity rule are regularly evaluated against monitoring data. All conditions in a rule are evaluated; the severity state is set to the highest level for which the condition evaluates to True. If none of the conditions are met, the severity state is set to Normal. If a condition cannot be evaluated because data is missing or unavailable, the state is set to Undefined.

An alarm is generated each time a multiple-severity rule enters a new state. In addition, you can configure a multiple-severity rule to perform one or more actions upon entering and/or exiting each state.

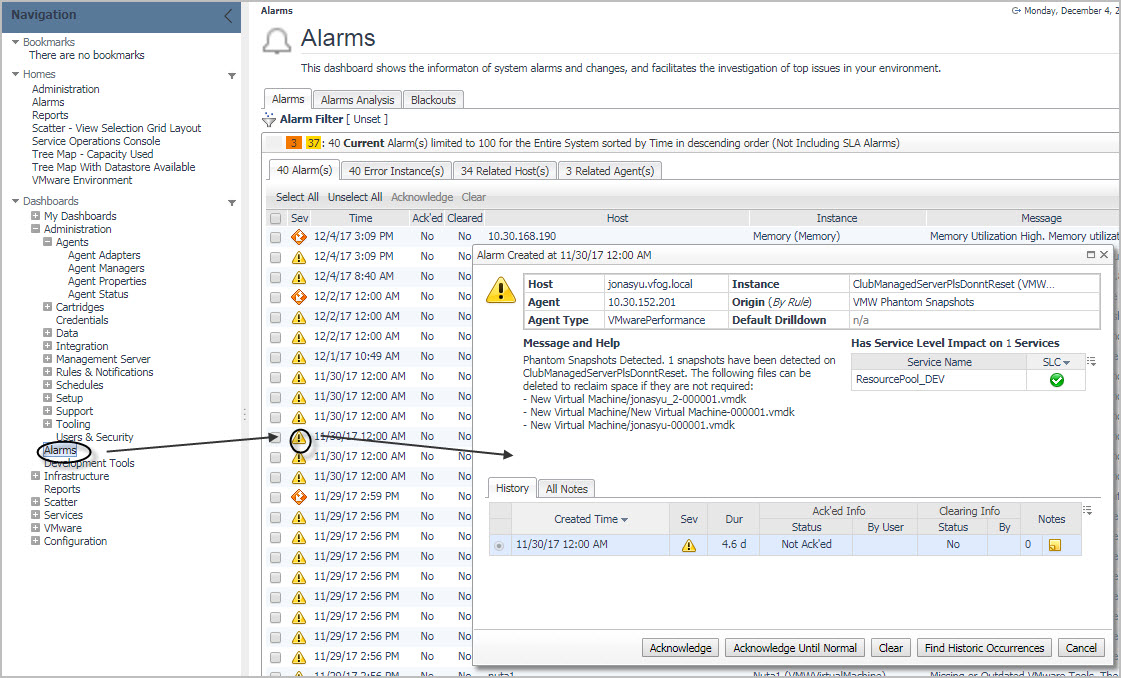
Generated alarms can be viewed in Foglight dashboards that exist outside of the Administration module, such as the Alarms or Agents dashboards. In addition to viewing alarm details, these dashboards allow you to drill down to alarm details, and to clear and acknowledge alarms.

The alarm list can show multiple alarms that are generated by the same rule. This is because rule conditions are evaluated repeatedly, after each data sampling interval. If rule conditions are met in subsequent sampling intervals, Foglight generates an alarm instance for each positive condition evaluation. These alarms can be of the same or different severity, depending on the value of the collected data. For example, a rule can produce multiple Warning alarms, or alarms whose severity ranges from Warning through Critical to Fatal.

Each alarm can be acknowledged or cleared. Acknowledging an alarm indicates that the Foglight operator is aware of the alarm. You can acknowledge a single alarm instance (by clicking Acknowledge in the alarm drill-down dialog box), or all consecutive alarms generated by the same rule (by clicking Acknowledge Until Normal).

Clearing an alarm indicates that the alarm is examined by the Foglight operator and that it is safe to remove it from the list. Along with cleared alarms, any acknowledged alarms can be removed from the list if required using the alarm filter.

For more information about working with alarms, see the Foglight User Guide.

Rule triggers determine the time at which its conditions are evaluated against the collected data. A rule can have one of the following triggers:

Unlike simple rules, that fire without raising any alarms, multiple-severity rules can generate alarms when their conditions are met. These alarms appear in many different dashboard. You can also create your own dashboards that display alarms. In order for alarms to work correctly in dashboards, they must be generated by multiple-severity, data-driven rules. Alarms generated by multiple-severity, time- or event- driven rules do not have the same functionality in dashboards as multiple-severity, data-driven rules.

A time-driven trigger causes one or more of a rule’s conditions to be evaluated once per pre-defined interval. By default, time-driven rules are only evaluated if data for the evaluation of the condition is available, but you can override this behavior, if required.

If a rule has a data-driven trigger, one or more if its conditions will be evaluated every time that new data associated with one or more topology types or objects to which the rule applies is sent to the Foglight Management Server. This option is selected as the default trigger.

An event-driven trigger causes one or more of a rule’s conditions to be evaluated as a response to a certain event. There are four types of events that can act as rule triggers:

AgentManagementSystemEvent: Foglight generates these types of events when an agent instance enters a certain state. Examples of agent states include New Instance, Registered, Unregistered, Activated, Deactivating, Data Collection Starting, Data Collection Stopping, and Obsoleted. These types of system events allow you to monitor the agents’ state and evaluate it in rule conditions.
AlarmSystemEvent. Multiple-severity rules generate system events when a rule severity level is reached, such as the Warning, Critical, or Fatal state. Alarm-based system events allow you to trigger alarm-related rules. This type of events can be useful, for example, when forwarding alarms to an external system or when sending notifications.
IncidentSystemEvent. Foglight creates an incident system event when an incident is created or modified. Incidents are used to group alarms based on a common parameter, and can result in ticket requests generated in an external system. The types of incident modifications you can evaluate in rule conditions include Create, Close, Acknowledge, Modify, and Delete.
ReportGeneratedEvent. Report generation creates events. You can monitor those events as required and use them to trigger report-related events.The type of report properties that you can evaluate in rule conditions include name, reportId, user, templateName, and many others.

A schedule-driven trigger causes one or more of a rule’s conditions to be evaluated during which a selected schedule is in effect. By default, schedule-driven rules are only evaluated if the data for the evaluation of the rule condition is available, but you can override this behavior, if required.

The scope of a rule defines the set of topology objects against which it runs. A rule can be scoped to a topology type and can optionally be scoped to specific topology objects of that type. If a rule is not scoped to specific objects, it applies to all instances of that type. The scope object is the object on which alarms will appear in the Foglight interface. The rule scope is specified using the query language. For more information, see Using the Query Language.

A rule can apply to a topology type or to one or more objects of that type. You can change the scope of a rule (the topology type or one or more specific topology objects to which it applies) after its creation.

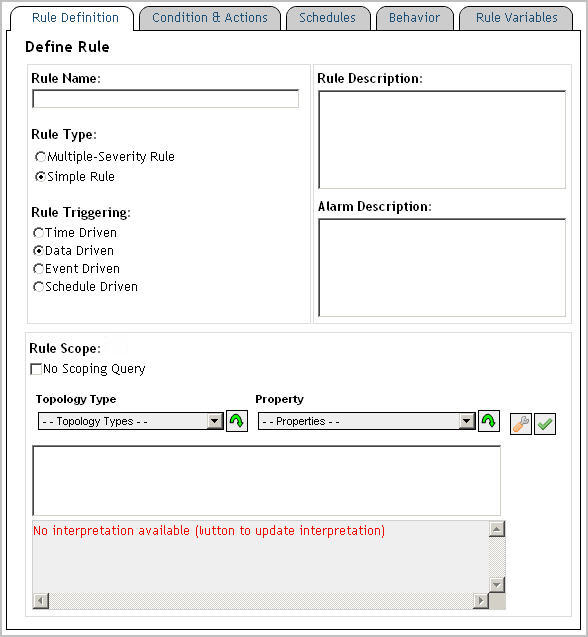
Use the Rule Definition tab to edit rule definitions. This tab allows you configure basic settings, such as the rule name, description, and alarm message. It also contains the settings for specifying the rule complexity, its trigger, and scope.

1
Open the Rule Definition tab.
On the Rule Definition tab, in the Rule Name box, type the rule name.
IMPORTANT: The following rule names are reserved and should not be used:
foglight_rule_name
foglight_rule_comments
foglight_rule_domain_query
foglight_rule_id
foglight_monitored_host_name
foglight_monitoring_agent_name
foglight_rule_alarm_link
oglight_scoping_id.

The foglight_monitored_host_name and foglight_monitoring_agent_name variables are only available for rules with scoping queries.
3
Optional — Describe the rule. In the Rule Description box, type the rule description.
4
Optional — Add information about the nature of the alarm message. In the Alarm Description box, type the information about the alarm that is generated by the rule when predefined thresholds are reached.
5
New rules only. Select the rule type.
Under Rule Type, select one of the following options: Simple Rule or Multiple-Severity Rule. The rule type determines the rule complexity. For more information, see Rule types.
a
Under Rule Triggering, select the Time Driven option.
Under Rule Triggering, ensure that the Data Driven option. This is the default setting.
a
Under Rule Triggering, select the Event Driven option.
Click Event Name and select one of the following events: AgentManagementSystemEvent, AlarmSystemEvent, IncidentSystemEvent, or ReportGeneratedEvent.
a
Under Rule Triggering, select the Schedule Driven option.
Click Triggering Schedule and select a schedule from the list that appears.
7
In the Rule Scope area, define the rule scope.

Rule expressions can reference different types of variables:

Foglight registry variables can be used in rule conditions, derived metric expressions, and rule-specific actions. A registry variable can have a global value that is available to all topology types and objects. It can also have one or more values associated with specific topology types or objects, or calendar dates. For more information, see Working with Foglight Registry Variables.

Foglight includes trigger-specific rule variables that can be used in conditional expressions of rules with certain trigger types. Each variable contains the information relative to the rule in which it is used. For example, if you create Rule A and use the rule-level variable foglight_rule_name as a parameter in an action that you add to Rule A, that parameter uses the actual rule name, Rule A.

Rules in Foglight can be triggered by data, time, or events. Different trigger types, such as time, data, and event triggers, have different rule-level variables available to them. For example, in an event-driven rule you can reference the properties of the system alarm event that triggers the rule directly.

Most of the rule variable are available in all contexts within a rule. However, foglight_rule_alarm_link, foglight_monitored_host_name, foglight_monitoring_agent_name and foglight_severity_message are not available in rule condition scripts. Also, foglight_severity_message is also not available at rule level. It is available only as severity level.

A collection of arguments provided to the script.  Unused and empty in rule condition/message evaluation.

Yes

Yes

Yes

The name of the cartridge this rule is deployed in, if available

Yes

Yes

Yes

The version of the cartridge this rule is deployed in, if available

Yes

Yes

Yes

The time at which the script is executing.  For data driven rules this is the latest timestamp in the incoming batch of observations.  For time-driven rules this is the time at which the rule fired.

Yes

Yes

Yes

System event.

Yes

No

No

Indicates if the alarm is transitioning from the Warning, Critical, or Fatal state to Warning, Critical, or Fatal (as applicable). For more information, see isTransition.

Yes

No

No

The target severity level the alarm is transitioning to. For more information, see nextSeverityLevel.

Yes

No

No

The previous severity level the alarm is transitioning from. For more information, see previousSeverityLevel.

Yes

No

No

Link for the alarm causing the event

Yes

No

No

The comments for the rule causing the event

Yes

No

No

The ID of the rule causing the event

Yes

No

No

The name of the rule causing the event

Yes

No

No

The severity level (0-4) causing the event

Yes

No

No

Name of the severity level causing the event

Yes

No

No

Event scope

Yes

No

No

An extension registry used to access interfaces provided by other cartridges

Yes

Yes

Yes

Link for the alarm

Yes

Yes

Yes

Comments for the rule

Yes

Yes

Yes

Rule domain query

Yes

Yes

Yes

Rule ID

Yes

Yes

Yes

Name of the agent monitoring the scoping topology object. Not all cartridges provide the data for this variable.

Yes

Yes

Yes

Rule name

Yes

Yes

Yes

ID of the topology object

Yes

Yes

Yes

Severity. Value is an integer in the 0-4 range (inclusive)

Yes

Yes

Yes

Name of the severity level

Yes

Yes

Yes

Message on the severity level used to generate alarms

Yes

Yes

No

Current Rule object

Yes

Yes

Yes

Rulette level persistence map. This data is preserved between rule invocations, but is lost on server restart

Yes

Yes

Yes

scope

The scoping topology object, if one has been set.

Yes

No

Yes

server

A reference to the server and its public API

Yes

No

Yes

Unlike severity-level variables, that can only be referenced in the expression associated with the severity level in which the variables are defined, rule-level variables can be referenced in any severity level.

There are two types of rule-level and severity-level variables:

Expressions. An expression is used to retrieve data. It can contain a registry variable or a function.
Messages. A message is typically a text string that can include other severity-level variables, displaying dynamically-supplied data about your monitored system.

var1

scope.get("agent/host/name")

Expression

var2

#CPU_Utilization#

Expression

var3

#Run_Queue_Length#

Expression

Text

@var1: CPU Utilization

Message

Subject

CPU Utilization is at @var2% and the number of process in the run queue is @var3. A CPU Bottleneck is being detected on @var1. Check the top processes (using the Top_CPU_Table) to determine which processes are the greatest contributors to CPU Loads, or follow the Foglight online help to find out if the system is CPU constrained. Please use the following URL to obtain alarm details. @foglight_rule_alarm_link

Message

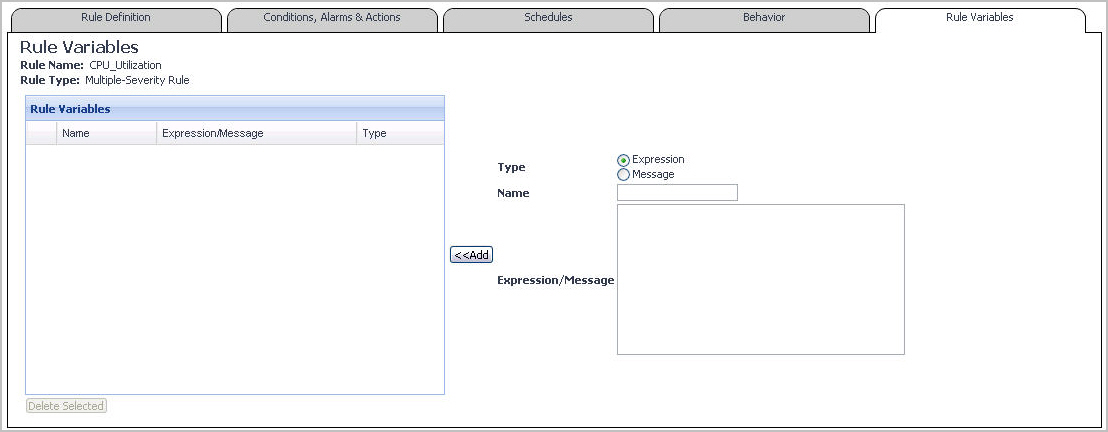
Rule-level variables can be referenced in conditional expressions in multiple severities. When your threshold requirements change, you can create new or edit the existing rule-level variables. Editing an existing rule-level variable affects the outcome of any rule conditions or alarm messages that reference that variable. If you plan to write or edit a conditional expression or an alarm message that includes one or more rule-level variables, ensure that those variables exist prior to writing the expression.

1
Open the Rule Variables tab.
2
In the Name box, type the name of the variable.
IMPORTANT: The following names are reserved and should not be used: foglight_severity_level and foglight_severity_level_name.

var1

scope.get("agent/host/name")

Expression

Text

@var1: CPU Utilization

Message

In the Expression/Message box, type the value of the variable.
5
Click Add.
The Rule Variables pane refreshes, showing the newly-added variable.

Severity-level variables can be referenced in conditional expressions associated with the severity level in which the expression is defined. When your threshold requirements change, you can create new or edit the existing severity-level variables. Editing an existing severity-level variable affects the outcome of any rule conditions or alarm messages that reference that variable. If you plan to write or edit a conditional expression or an alarm message that includes one or more severity-level variables, ensure that those variables exist prior to writing the expression.

1
Open the Conditions, Alarms, and Actions tab (multiple-severity rules) or Conditions and Actions tab (simple rules).
3
Select the Severity Level Variables tab.
The Severity Level Variables tab appears in the severity-level definition pane.
4
In the Name box, type the name of the variable.
IMPORTANT: The following names are reserved and should not be used: foglight_severity_level and foglight_severity_level_name.

var1

scope.get("agent/host/name")

Expression

Text

@var1: CPU Utilization

Message

In the Expression/Message box, type the value of the variable.
7
Click Add.
The Severity Level Variables pane refreshes, showing the newly-added variable.

A condition is the part of a rule that is evaluated against monitoring data. When it evaluates to True, the rule is said to fire, causing any actions that are associated with the rule or severity level to be performed.

When you create a simple rule, you specify a single condition for it. You can edit this condition after you create the rule. When you create a multiple-severity rule, you must specify a condition for one or more of its severity levels, Fatal, Critical, and Warning, along with an alarm message that is associated with each condition.

A conditional expression can be either true or false. Conditional expressions can reference registry, Groovy functions, and metrics associated with the one or more topology types or their topology objects to which the rule is scoped.

Additionally, conditional expressions can reference properties of topology objects that are related (within the hierarchy of the topology model) to one or more topology objects to which the rule is scoped. For example, the condition for a simple rule that is associated with a specific JVM can reference properties of the server on which the JVM is running (such as the server name), or properties of the cluster to which the server belongs.

Furthermore, event-driven rules can retrieve data generated by report- and alarm-related events.

Expressions can be simple—for example, an expression can consist only of a metric name—but they can also be defined using very complex syntax.

Conditional expressions make use of the query language. For more information, see Using the Query Language.

Foglight generates an alarm message when the conditional expression associated with a multiple-severity rule evaluates to True. An alarm message is typically a text string that can include other severity-level variables, displaying dynamically-supplied data about your monitored system.

Simple rules do not generate alarms. They fire when the condition for their Fire state is met. Multiple-severity rules generate alarms each time they enter a severity state.

Expressions and messages can be set with one of two distinct scopes: Rule-scoped expressions and messages and Severity-scoped expressions and messages.

They can be referenced by the actions set for the Fire and Undefined states of a simple rule and for all severity levels (Fatal, Critical, Warning, Normal, and Undefined) in a multiple-severity rule.

They can only be referenced by the actions set for the specific rule level at which the message is defined. For example, if an expression is defined for the Fatal level of a multiple-severity rule, it can only be referenced by the actions that are set for that severity level.

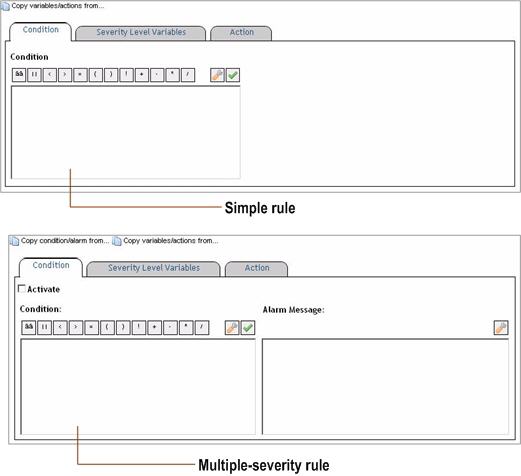
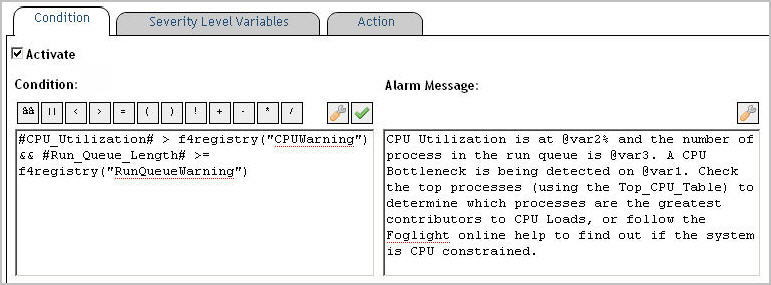
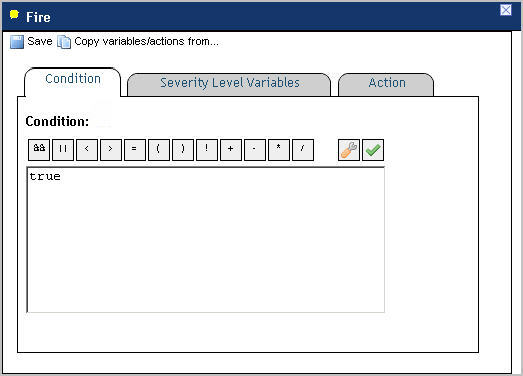
A conditional expression is the part of a rule that is evaluated against monitoring data. When it evaluates to True, the rule is said to fire, causing any actions that are associated with the rule or severity level to be performed. A conditional expression can reference variables, topology object metrics, and Groovy functions. Use the Condition tab to specify a conditional expression.

1
On the Conditions and Actions tab (simple rules) or Conditions, Alarms & Actions tab (multiple-severity rules), open the Conditions tab.
In the Condition tab, use the Condition area to write the conditional expression.
You can type the condition directly into the Condition box, or use the operator controls and the Condition Editor to add logical operators, registry variables, metrics, or Groovy functions.
IMPORTANT: Conditional expressions that reference metric properties using the syntax scope.get("aMetric") or metrics using the service layer (for example, server["DataService"].retrieveLatestValue(…)) prevent data-driven rules from firing. Similarly, failing to include a metric reference prevents data-driven rules from triggering. To reference a metric directly use the "#aMetric#" syntax.

println @event.dump();

@event.get("report/name") == "MyReport";

println @event.dump()

@event.get("report/name") == "MyReport";

println @event.dump();

println @event.dump()

3
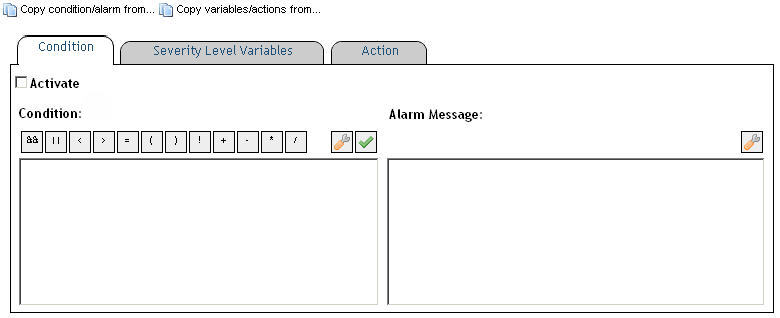
Multiple-severity rules. Activate the condition by selecting Activate.
You must activate the condition for a severity level in a multiple-severity rule before you can save it. If the Activate check box is cleared when you click Save, the condition that you specified will be discarded, as will any expressions or actions that you set in the sub-tabs of the tab for that severity level.
IMPORTANT: Do not clear the Activate check box if you want to temporarily disable a rule. To temporarily deactivate the alarms and actions for an entire rule, follow the instructions in Suspending or resuming rule alarms. You can also configure the behavior of the alarms and actions for the rule. See Configure alarm and action behaviorfor more information.
4
Multiple-severity rules. Define the alarm message associated with the newly-defined condition.
In the Alarm box, type the alarm message.
5
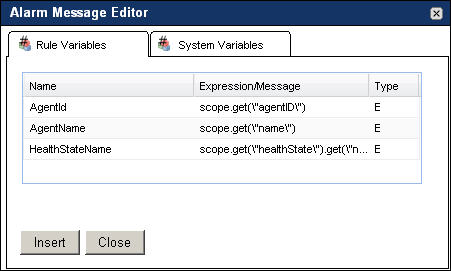
Multiple-severity rules (Optional). To reference a rule-level variable or a system variable in the alarm message, in the Alarm Message box, click the location in which you want to add the variable, and then click the Alarm Message Editor button () above the Alarm Message box.
To add a rule-level variable, in the Alarm Message Editor dialog box, on the Rule Variables tab, select the rule-level variable and click Insert.
To add a system variable, on the System Variables tab, select the system variable and click Insert.
6
Save the newly-defined rule condition by clicking the Save button above the Condition tab.

When you write conditions for event-driven rules, in addition to variables, topology object metrics, and Groovy functions, you can use events and their properties to trigger rule actions.

Event-driven rules allow you to monitor the events generated every time a pre-defined event occurs. There are several types of events that can act as rule triggers: AlarmSystemEvent, DatabaseMaintenanceEvent, IncidentSystemEvent, and ReportGeneratedEvent.

Multiple-severity rules generate system events when a rule severity level is reached. Foglight creates an AlarmSystemEvent object instance for each alarm system event. The types of rule severity include Undefined, Normal, Warning, Critical, or Fatal state. The change property of an AlarmSystemEvent object instance indicates the rule severity. Alarm-based system events allow you to trigger alarm-related rules. This can be done by evaluating the values of AlarmSystemEvent properties in rule conditions.

Table 33. The AlarmSystemEvent object properties, their data types, and descriptions

String

Contains the ID of the alarm that generates the event.

String

Contains the URL to the alarm.

Date

Specifies the time at which the alarm is cleared.

AlarmChangeType

Specifies the alarm change type: Fire, Clear, Acknowledge or UserDefinedData.

Date

Specifies the time at which the alarm is created.

Boolean

Determines if the event is acknowledged. It can be set to True or False.

Boolean

Determines if the event is cleared. It can be set to True or False.

Boolean

Indicates if the alarm is transitioning from the Warning, Critical, or Fatal state to Warning, Critical, or Fatal (as applicable). For new and clearing alarms, this value is always False. Foglight creates events for newly-created alarms, cleared alarms, or existing alarms transitioning to a new state, as follows:

Clearing alarms generate a single Clear event with isTransition set to False.

New alarms generate a single Fire event with isTransition also set to False.

Existing alarms transitioning from the Warning, Critical, or Fatal state to Warning, Critical, or Fatal (as applicable) generate two events: a Clear event for the old severity, and a Fire event for the new severity. The isTransition flag in both events is set to True.

External systems can make use of this behavior when evaluating events, to distinguish between clearing and non-clearing alarms.

Integer

Indicates the target the alarm is transitioning to. For clearing alarms, the next severity level is always 0 (Normal). Foglight creates events for newly-created alarms, cleared alarms, or existing alarms transitioning to a new state, as follows:

Clearing alarms generate a single Clear event with the next severity level of 0 (Normal).

New alarms generate a single Fire event with the next severity level of 2 (Warning), 3 (Critical), or 4 (Fatal).

Existing alarms transitioning from the Warning, Critical, or Fatal state to Warning, Critical, or Fatal generate two events: a Clear event for the old severity, and a Fire event for the new severity. The next severity level in both events is set to the target severity (Warning, Critical, or Fatal).

External systems can make use of this behavior when evaluating Clear events, to distinguish between clearing and non-clearing alarms.

String

Contains the alarm message.

Integer

Indicates the previous severityLevel the alarm is transitioning from. For new alarms, the previous severity level is always 0 (Normal). Foglight creates events for newly-created alarms, cleared alarms, or existing alarms transitioning to a new state, as follows:

Clearing alarms generate a single Clear event with the previous severity level of 2 (Warning), 3 (Critical), or 4 (Fatal).

New alarms generate a single Fire event the previous severity level of 0 (Normal).

Existing alarms transitioning from the Warning, Critical, or Fatal state to Warning, Critical, or Fatal (as applicable) generate two events: a Clear event for the old severity, and a Fire event for the new severity. The previous severity level in both events is set to the original severity (Warning, Critical, or Fatal).

External systems can make use of this behavior when evaluating Fire events, to distinguish between clearing and non-clearing alarms.

String

Contains any comments associated with the rule that generates the alarm.

String

Contains the ID of the rule that generated the alarm.

String

Contains the name of the rule that generated the alarm.

Integer

Contains a number that identifies the severity level:

0: Normal

1: Fire

2: Warning

3: Critical

4: Fatal

String

Contains one of the following values that identify the severity level: Undefined, Normal, Warning, Critical, or Fatal.

String

Contains the ID of the entity that generated the alarm. If the alarm is triggered by a rule, this is the rule ID.

String

Contains the name of the entity that generated the alarm. If the alarm is triggered by a rule, this is the rule name.

String

Contains the ID of the scoped topology object. If the alarm is triggered by a rule, this is the ID of the topology object to which the rule is scoped.

DataObject

Contains a data object that includes any additional information about the alarm. This data can be used when creating event-related dashboards. For more information about creating dashboards, see the Foglight User Guide.

Each AlarmSystemEvent object instance contains an AlarmChangeType object instance that stores information about the incident type. You can reference AlarmChangeType property values in rule conditions. For example:

Table 34. The AlarmType object properties, their values, and descriptions.

0

Indicates that the alarm is in the Fire state

1

Indicates that the alarm has been cleared

2

Indicates that the alarm is acknowledged

3

Indicates that the alarm is in a user-defined state

Foglight creates a DatabaseMaintenanceEvent as it performs maintenance operations during the nightly maintenance window. An event will be sent before each operation is run, and after it ends. The operationName property in the event specifies the operation that is being performed. The server also sends a started event for the "DatabaseMaintenance" operation before it runs the individual maintenance operations, and sends a ended event for "DatabaseMaintenance" operation after all the individual operations have been run.

Table 35. The DatabaseMaintenanceEvent object properties, their data types, and descriptions.

createdTime

Date

The time that the event was fired.

eventType

DatabaseMaintenanceEvent

An enumeration object that specifies whether this is a “Started” or “Ended” event.

startTime

Date

The time that the operation started.

Table 36. Properties available only for Ended events.

endTime

Date

The time that the operation ended.

completed

Boolean

A flag indicating whether the operation completed. An operation will not have completed if it failed or stopped due to time constraints.

errorMessage

String

If a task fails, this property contains the associated error message.

Foglight creates an incident system event when an incident is created or modified. Incidents are used to group alarms based on a common parameter, and can result in ticket requests generated on an external system. For each incident, Foglight creates an IncidentSystemEvent object instance. The types of incident modifications include Create, Close, Acknowledge, Modify, and Delete. The type of incident modification is indicated in the IncidentSystemEvent object’s change property. Incident-based system events allow you to trigger incident-related rules. This can be done by evaluating the values of IncidentSystemEvent properties in rule conditions.

Table 37. The IncidentSystemEvent object properties, their data types, and descriptions.

String

Contains the name of the Foglight user who acknowledged the incident.

Date

Contains the date and time at which the incident was acknowledged.

TopologyObject

Contains the topology object that is affected by the incident.

IncidentChangeType

Indicates the type of change made to the incident. There are several types of changes: Create, Close, Acknowledge, Modify, and Delete. For more information about these change types, see their descriptions in the table below.

String

If the incident is created manually, as opposed to being generated by the system, this property contains the name of the Foglight user who created the incident.

String

If the incident is created manually, as opposed to being generated by the system, this property contains the name of the Foglight user who ended the incident.

Date

Contains the actual date and time at which the incident ended. If an operator overrides the system-reported end time, this property contains the end time override, stored in endTimeOverride. If no end time override takes place, it contains the system-reported end time, stored in endTimeReported.

Date

If an operator overrides the system-reported end time, this property contains the end time override.

Date

Contains the date and time at which the incident ended, as reported by the system.

String

Contains the incident ID.

Boolean

Determines whether the incident is acknowledged (True) or not (False).

Boolean

Determines whether the incident has ended (True) or is still taking place (False).

Date

Contains the date and time at which the incident was last updated.

String

Contains the name of the Foglight user who most recently updated the incident.

String

Contains one or more IDs of the alarms that are grouped by the incident.

String

Contains a message associated with the incident.

String

Identifies the parent node in the incident object tree.

String

Contains the ticket ID associated with the incident.

Integer

Contains a number that identifies the severity level:

0: Undefined

1: Normal

2: Warning

3: Critical

4: Fatal

Date

Contains the actual date and time at which the incident started. If an operator overrides the system-reported start time, this property contains the start time override, stored in startTimeOverride. If no start time override takes place, it contains the system-reported start time, stored in startTimeReported.

Date

If an operator overrides the system-reported start time, this property contains the start time override.

Date

Contains the date and time at which the incident started, as reported by the system.

String

Contains the incident type.

Each IncidentSystemEvent object instance contains an IncidentChangeType object instance that stores information about the incident type. You can reference IncidentChangeType property values in rule conditions. For example:

Table 38. The IncidentChangeType object properties, their values, and descriptions.

0

Indicates that the incident is created

1

Indicates that the incident is closed

2

Indicates that the incident is acknowledged

3

Indicates that the incident is modified

4

Indicates that the incident is deleted

Report generation creates system events. Foglight creates a ReportGeneratedEvent object instance for each report generation event. The type of report properties that you can evaluate include name, reportId, usertemplateName, and many others. Report properties are contained in the ReportGeneratedEvent object’s report property. Report-based system events allow you to trigger report-related rules. This can be done by evaluating the values of ReportGeneratedEvent properties in rule conditions.

Table 39. The ReportGeneratedEvent object properties, their data types, and descriptions.

Date

Specifies the time at which the event is created.

Report

Contains an object of the Report type.

For complete information about creating and scheduling reports in Foglight, see the Foglight User Guide.

Each ReportGeneratedEvent object instance contains a Report object instance that stores information about a report. You can reference Report object properties in rule conditions. The following table lists the

Table 40. The Report object properties, their data types, and descriptions.

Date

The date on which the report is run.

String

The email recipients to which the report is to be sent.

String

An error message associated with the report.

Boolean

Specifies whether the report generation is enabled.

String

The report name.

Integer

The number of records in that are retained in the report.

String

The report ID.

String

The ID of the schedule that is associated with the report.

String

The name of the schedule that is associated with the report.

Integer

The report size in bytes.

String

The ID of the template used to create the report.

String

The name of the template used to create the report.

String

The name of the Foglight user who created the report.

A conditional expression is the part of a rule that is evaluated against monitoring data. When it evaluates to True, the rule is said to fire, causing any actions that are associated with the rule or severity level to be performed. In addition to variables, topology object metrics, and Groovy functions, a conditional expression associated with an event-driven rule can also reference the properties of the event that acts as the rule trigger. For example, you can write a condition for an event-driven rule that fires when Foglight generates a report.

1
On the Conditions and Actions tab (simple rules) or Conditions, Alarms & Actions tab (multiple-severity rules), open the Conditions tab.
In the Condition tab, use the Condition area to write the conditional expression. using the following syntax:
some_value.equals(@event.get("[object/]property");
report indicates that you want to use the ReportGeneratedEvent in the conditional expression.
object is the name of the event's property object whose property value you want to retrieve.
property is the name of the event property that you want to use in the comparison.
some_value contains the value that is to be compared with the specified property value.
@event.get("report/name") == "System Resources";
byte[] pdf_object =
server.get("ReportingService").getReportData(@event.get
Where pdf_object is the name of the report file that you want to retrieve.
3
Multiple-severity rules. Activate the condition by selecting the Activate check box.
You must activate the condition for a severity level in a multiple-severity rule before you can save it. If the Activate check box is cleared when you click Save, the condition that you specified is discarded, as are any severity-specific expressions or actions.
IMPORTANT: Do not clear the Activate check box if you want to temporarily disable a multiple-severity rule. To temporarily deactivate the alarms and actions for an entire rule, follow the instructions in Suspending or resuming rule alarms. You can also configure the behavior of the alarms and actions for the rule. See Configure alarm and action behavior for more information.
4
Multiple-severity rules. Define the alarm message associated with the newly-defined condition.
In the Alarm box, type the alarm message.
5
Multiple-severity rules (Optional). To reference a rule-level variable or a system variable in the alarm message, in the Alarm Message box, click the location to which you want to add the variable, and then click the Alarm Message Editor button () above the Alarm Message box.
To add a rule-level variable, in the Alarm Message Editor dialog box, on the Rule Variables tab, select the rule-level variable and click Insert.
The Rule Variables tab lists all of the rule-level variables, including expressions and messages.
To add a system variable, on the System Variables tab, select the system variable and click Insert.
6
Save the newly-defined rule condition by clicking the Save button above the Condition tab.

In some cases you may need to copy the conditions from an existing severity level. A condition is comprised of a conditional expression and an alarm message, both of which can be copied.

Copying a condition can be useful in situations when the conditional expressions of different severities are similar, so instead of writing and validating them for each severity level you can copy an existing expression and modify it to suit your needs.

While you are editing the rule, any unsaved changes to the conditional expressions or alarm messages that you want to copy will be carried over to the destination condition. For example, if you edit a conditional expression for the rule’s Warning severity without saving it, and then proceed to copy that condition in the Critical pane, any unsaved edits of the Warning condition will be carried over to the Critical condition.

Copying a conditional expression from one severity to another without modifying it results in multiple conditions with the same expression. While this type of rule configuration is allowed, a confirmation message appears to make you aware of that. When such a condition is met, it triggers the higher severity. For example, if both Warning and Critical conditions have the same expressions, when that condition is met, the rule enters the Critical severity. An exception to this case is when the expressions resolve the same condition using a slightly different combination of characters. For example, abc>1, abc >1, and abc > 1 are considered different expressions, and as such are evaluated separately.

1
Open the Conditions, Alarms & Actions tab.
2
On the Conditions, Alarms & Actions tab, open the Conditions tab.
a
Click the Copy condition/alarm button above the Condition tab.

An action is a particular operation that is performed when a rule enters or exits a state when its condition is met. Simple and multiple-severity rules can be associated with multiple actions. Additionally, each severity level in a multiple-severity rule can have one or more actions. Actions can be added to a rule after it is created.

For example, you can associate an email action with a rule condition. When the rule condition evaluates to True, Foglight sends an email to the selected recipient, with the alarm message in the email body.

There are two types of actions in Foglight:

Entering. It causes the action to be performed when a simple rule or a severity level in a multiple-severity rule enters the state in which the condition for that rule or severity level is met.
It is a best practice that Entering actions be used by default.
Exiting. It causes the action to be performed when a simple rule or a severity level in a multiple-severity rule exits the state in which the condition for that rule or severity level is met.
Use of the Exiting action should be restricted to cases where an action specific to the state is needed. For example, if an Entering action starts a script, then the Exiting action can be used to stop the script.

The actions available in Foglight are as follows:

BSM actions. Business Service Management (BSM) actions send alarm data to external systems such as Tivoli.
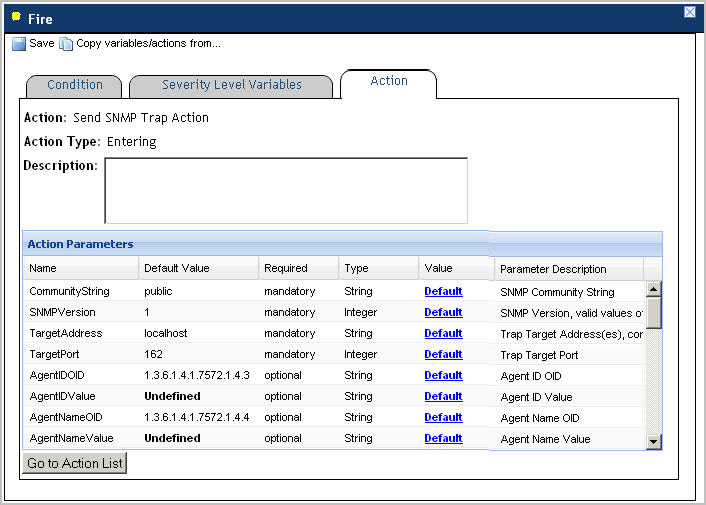
SNMP trap actions. They cause alarms to be forwarded as Simple Network Management Protocol (SNMP) traps to a management system that supports SNMP (such as Tivoli® NetView®, Micromuse NetCool® or HP® Vantage Point®) when the rule fires. Various parameters can be set for sending the SNMP trap, including the community, the host and port for the monitoring service.
Email actions. They cause email messages to be sent to a specified recipient when the rule fires. For more information about viewing the settings related to email actions and configuring email actions in Foglight, see Configuring email notifications
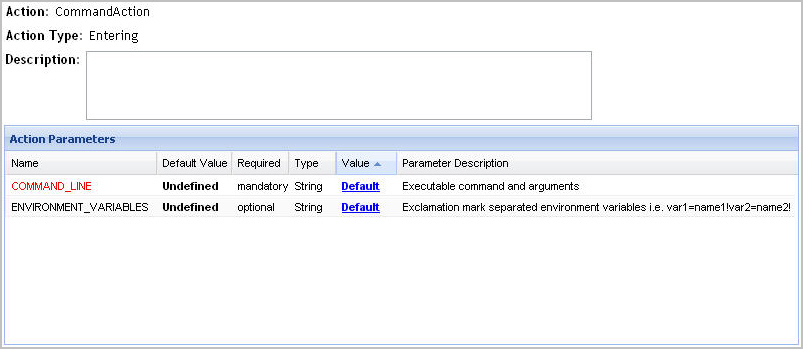
Command actions. They cause an external action to be executed on the computer on which the Foglight Management Server is installed. For example, a command action can run an executable that starts a service. Various parameters can be set for this action. The mandatory parameter is COMMAND_LINE which contains the name of the executable, along with one or more arguments. Optionally, you can also set OS environment variables (separated by exclamation marks).
Remote command actions. They cause an external action to be executed on a monitored host. Various parameters can be set for this action including the mandatory parameter COMMAND_LINE.
Script actions. They cause an arbitrary script, deployed inside the server (such as a Groovy script), that runs when the rule fires. This is to be used for any integration not available through built-in actions. Various parameters can be set for this action, such as script name (mandatory), scoping topology ID, scripting object ID, and arguments (up to ten) associated with the script. The number and order of arguments (0-9) specified as action parameters must match the script requirements. There is currently no validation facility for script actions.
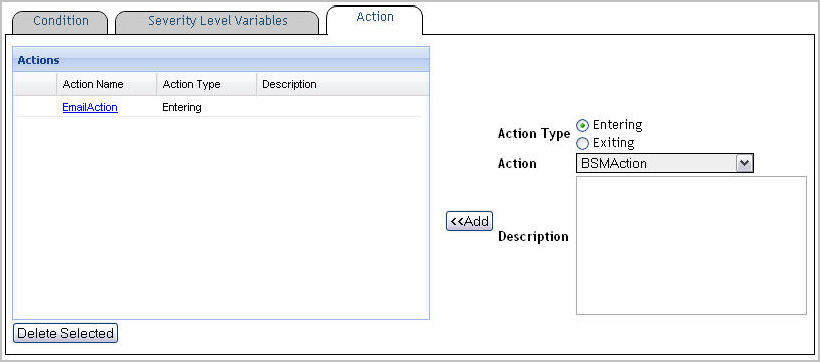
1
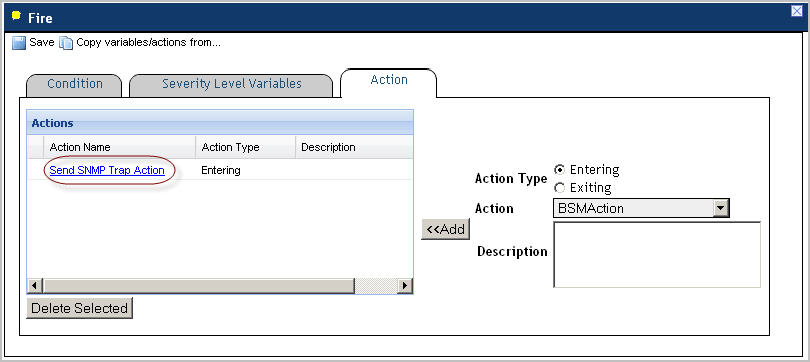
In the Conditions and Actions tab (simple rules) or Conditions, Alarms & Actions tab (multiple-severity rules), open the Action tab.
Select one of the following Action Type options: Entering or Exiting.
Click Action and select an action from the list that appears. There are several actions to choose from: BSMAction, CommandAction, EmailAction, RemoteCommandAction, ScriptAction, and Send SNMP Trap Action. For more information about each of these actions, see Foglight actions.
In the Description box, type the action description.
5
Click Add.

From here, you can edit the action parameters as required. For more information, see Editing rule action parameters.

Each rule action includes a set of action parameters that can define its behavior. Some action parameters are mandatory while others are optional.

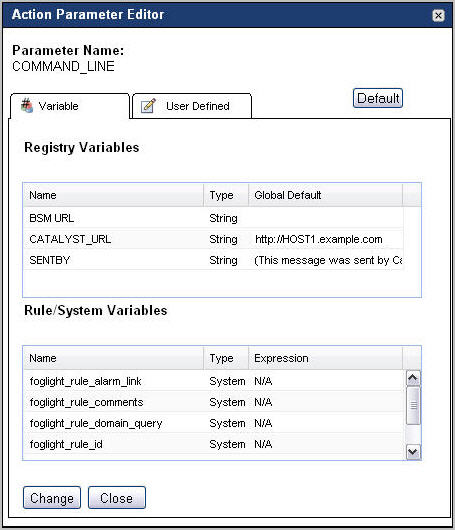
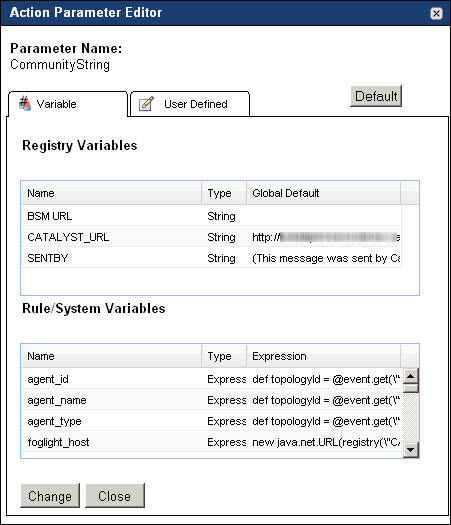
When you add an action to a rule, you must configure the action’s mandatory parameters to ensure its execution when the rule reaches the severity level for which the action is defined. Action parameters can contain Foglight registry variables, rule-level variables, or any custom value. The data type of the specified value must match the action parameter’s data type.

For example, a command action must have the command name associated with it, and in some cases, one or more environment variables. The command name is a mandatory parameter, while the environment variables are optional parameters. However, failing to specify environment variables related the command prevents the command action from being executed.

Alarm system event

Yes

The alarm system event generated by Foglight.

Syntax:

<alarm event>

Example:

[alarmEvent]/Rule/System Variable

Setting this event to the alarmEvent Rule System variable selects all alarms.

alarm.notification.service.backToNormal

Yes

Indicates whether or not send a email notification when the service is back to normal. The recipient will be the same as the one defined in registry variable mail.alias.alarmRecipients.

alarm.notification.service.backToNormal.body

Yes

The body message of the alarm that will be sent when the service is back to normal. The serviceName variable of the service that triggers this alarm will be overwritten.

alarm.notification.service.backToNormal.subject

Yes

The subject of the alarm that will be sent when the service is back to normal.The serviceName variable of the service that triggers this alarm will be overwritten.

BSM URL

Yes

The URL of the BSM system to which to send the data.

Syntax:

<BSM_URL>

Example:

http://www.example.com

Event Attributes

Managed Control Attributes

Technology Level Agreement Attributes

No

Event Attributes, Managed Control Attributes, and Technology Level Agreement Attributes are optional attributes to pass to the BSM system. The BSM action automatically uses the alarm attributes to populate these values, however, it is possible to overwrite them using these parameters.

For more information about these attributes, see the Service Discovery and Dashboards documentation.

Syntax:

<attribute_1>=<value_1>!<attribute_2>=<value_2>!…!<attribute_n>=<value_n>

Example:

Service=Performance!Value=90

COMMAND_LINE

Yes

The native command that you want to run on the local system where the Management Server is installed.

Syntax:

<command> [arg_1] … [arg_n]

Example:

C:\notepad.exe

This command starts the Notepad executable on the C drive.

If the command is not accessible from the <Foglight_home> directory, you need to specify its path.

ENVIRONMENT_VARIABLES

No

A list of environment variables that you want to reference on the command line. Multiple environment variables can be separated by exclamation marks ‘!’.

Syntax:

<var_1>=<value_1>!<var_2>=<value_2>!…! <var_n>=<value_n>

Example:

MY_PROFILE=C:\Users\jsmith!MY_SHARE=\\example.com\home\jsmith

mail.attachement

No

The name of the file to be added as an attachment to the email.

Example:

Report1.pdf

mail.attachement.file.name

Yes

The file name of the email attachment that you want to send in the email.

Syntax:

<file.extension>

Example:

test.docx

mail.attachement.mime.type

Yes

The MIME type of the email attachment, specified using the <application>/<file type> format.

Syntax:

<application>/<file type>

Example:

Acrobat/pdf

Supported MIME types do not depend on the Management Server settings, but on the email server.

mail.bcc

No

A list of email addresses to send as a Blind CC list. Uses a comma ‘,’ as a separator.

Syntax:

<email_address_1>,<email_address_2>,…,<email_address_n>

Example:

jsmith@example.com,ldoe@example.com

mail.cc

No

A list of email addresses to send as a CC list. Uses a comma ‘,’ as a separator.

Syntax:

<email_address_1>,<email_address_2>,…,<email_address_n>

Example:

jsmith@example.com,ldoe@example.com

mail.content.type

Yes

This parameter can be set to text/plain or text/html.

Syntax:

<text/plain>|<text/html>

Example:

text/html

mail.message

No

The text of the email message.

Syntax:

<email_text>

Example:

This is an email message from Foglight.

NOTE: When the condition of a simple rule is met, the rule enters the Fire state. By default, simple rules do not generate alarms when their conditions are met. Some simple rules that ship with Foglight create observation alarms that are not directly associated with the original rule. This is accomplished by calling the checkObservationAlarms() function in the rule condition. When the condition of a simple rule includes a call to the checkObservationAlarms() function, and the rule includes an email action, in the message body of the resulting email, the following text always precedes the value specified by the mail.message parameter:

The following alarms have been raised. Please use the provided URLs to obtain alarm details.

For more information about the checkObservationAlarms() function, see Using Functions in Conditions and Expressions.

mail.recipient

Yes

The email address of the recipient to whom you want to send the email message. It overrides the value set by the global mail.recipient registry variable.

Syntax:

<email_address>

Example:

jsmith@example.com

mail.subject

No

The subject line of the email message that you want to send.

Syntax:

<email_subject>

Example:

Email message from Foglight.

COMMAND_LINE

Yes

The command that you want to execute on the monitored system.

Syntax:

<command> [arg_1] … [arg_n]

Example:

C:\notepad.exe

This command starts the Notepad executable on the C drive of the monitored system.

If the command is not accessible from the <Foglight_home> directory, you need to specify its path.

ENVIRONMENT_VARIABLES

No

A list of environment variables that you want to reference on the command line. Multiple environment variables can be separated by exclamation marks ‘!’.

Syntax:

<var_1>=<value_1>!<var_2>=<value_2>!…! <var_n>=<value_n>

Example:

MY_PROFILE=C:\Users\jsmith!MY_SHARE=\\example.com\home\jsmith

HostName

Yes

The name of the host computer on which the command is to be executed.

Syntax:

<host_name>

Example:

Host1

MatchAll

No

When set to true, the command is executed on all hosts matching the selection criteria. When set to false, the command executes only on the first matching host.

Syntax:

<true|false>

Example:

true

PlatformInfo

No

The target platform specification.

Syntax:

<OS_name> <OS_version> <OS_architecture>

Example:

windows 5.0 ia32

RemoteInstallationId

No

The installation ID of the Agent Manager. This information is useful if there are multiple remote agents that support remote command execution.

Syntax:

<Agent Manager installation ID>

Example:

6624671a-e5b5-4bd5-9278-4e5ecc1ff173

This ID can be found in the <Agent_Manager_home>\state\default\config\fglam.config.xml file, between the <config:id> tags.

RemoteWorkingDir

No

Working directory on the remote machine.

Syntax:

<directory_path>

Example:

C:\Users\jsmith

UseRegExp

No

Indicates whether the values specified by the HostName, PlatformInfo, and RemoteInstallationId parameters are regular expressions.

Syntax:

<true|false>

Example:

true

Argument 1-10

No

Since the script action executes a custom script, the meaning of these arguments depends on the script requirements. For example, if the script requires a host name and an agent name in that order, then Argument 1 should contain the host name and Argument 2 should be the agent name.

Syntax:

<Argument>

Example:

Host1.example.com

Scoping object id

No

The ID of the scoping object.

Syntax:

<topology_object_ID>

Example:

01db-dc768-36ad-48b4-d33c-76bdc3145cbd

Script name

Yes

The name of the script.

Syntax:

<script_name>

Example:

myScript

The XML can be imported into the server using the util:configimport command. For more information about this and other fglcmd commands, see the Command-Line Reference Guide.

CommunityString

Yes

The SNMP community string.

SNMPVersion

Yes

The SNMP version.

Syntax:

<1|2>

Example:

2

TargetAddress

Yes

One or more trap target addresses, comma-separated.

Syntax:

<host_1>,<host_2>,,<host_n>

Example:

myHost

TargetPort

Yes

The target port of the trap receiver.

Syntax:

<port_number>

Example:

162

AgentIDOID

No

The object ID of the agent ID that is defined in the MIB file.

Syntax:

<object_ID>

Example:

1.3.6.1.4.1.7572.1.4.3

AgentIDValue

No

Agent ID value of the trap variable defined in the MIB file.

AgentNameOID

No

The object ID of the agent name that is defined in the MIB file.

Syntax:

<object_ID>

Example:

1.3.6.1.4.1.7572.1.4.4

AgentNameValue

No

Agent name value of the trap variable defined in the MIB file.

AgentTypeOID

No

The object ID of the agent type that is defined in the MIB file.

Syntax:

<object_ID>

Example:

1.3.6.1.4.1.7572.1.4.2

AgentTypeValue

No

Agent type value of the trap variable defined in the MIB file.

AgentMessageOID

No

The object ID of the agent message that is defined in the MIB file.

Syntax:

<object_ID>

Example:

1.3.6.1.4.1.7572.1.4.1

AgentMessageValue

No

Agent message value of the trap variable defined in the MIB file.

DateTimeOID

No

The object ID of the date and time format that is defined in the MIB file.

Syntax:

<object_ID>

Example:

1.3.6.1.4.1.7572.1.4.14

DateTimeValue

No

Date/time value of the trap variable defined in the MIB file.

HostIPOID

No

The object ID of the host IP that is defined in the MIB file.

Syntax:

<object_ID>

Example:

1.3.6.1.4.1.7572.1.4.11

HostIPValue

No

Host IP value of the trap variable defined in the MIB file.

Syntax:

<IP_address>

Example:

168.212.226.204

HostMACOID

No

The object ID of the host MAC address that is defined in the MIB file.

Syntax:

<object_ID>

Example:

1.3.6.1.4.1.7572.1.4.12

HostMACValue

No

Host MAC value of the trap variable defined in the MIB file.

Syntax:

<MAC_value>

Example:

00-0B-C2-78-76-BA

HostnameOID

No

The object ID of the host name that is defined in the MIB file.

Syntax:

<object_ID>

Example:

1.3.6.1.4.1.7572.1.4.10

HostnameValue

No

The host name value of the trap variable defined in the MIB file.

Syntax:

<host_name>

Example:

myHost

RuleIDOID

No

The object ID of the rule ID that is defined in the MIB file.

Syntax:

<object_ID>

Example:

1.3.6.1.4.1.7572.1.4.5

RuleIDValue

No

The Rule ID value of the trap variable defined in the MIB file.

Syntax:

<rule_ID>

Example:

630861d6-fa0d-45f0-9a64-47b617df9c5e

RuleNameOID

No

The object ID of the rule name that is defined in the MIB file.

Syntax:

<object_ID>

Example:

1.3.6.1.4.1.7572.1.4.6

RuleNameValue

No

The rule name value associated with the trap in the MIB file.

Syntax:

<rule_name>

Example:

Agent Health State

SeverityOID

No

The severity object ID defined in the MIB file.

Syntax:

<object_ID>

Example:

1.3.6.1.4.1.7572.1.4.9

SeverityValue

No

The severity value of the trap variable defined in the MIB file.

Syntax:

<severity>

Example:

Warning

TopologyObjectIDOID

No

The object ID of the topology object ID that is defined in the MIB file.

Syntax:

<object_ID>

Example:

1.3.6.1.4.1.7572.1.4.7

TopologyObjectIDValue

No

The topology object ID value of the trap variable defined in the MIB file.

Syntax:

<topology_object_ID>

Example:

01db-dc768-36ad-48b4-d33c-76bdc3145cbd

TopologyObjectNameOID

No

The name of the topology object ID that is defined in the MIB file.

Syntax:

<object_ID>

Example:

1.3.6.1.4.1.7572.1.4.8

TopologyObjectNameValue

No

The topology object name associated with the trap in the MIB file.

Syntax:

<object_name>

Example:

Host1.example.com

URLOID

No

The object ID of the URL value defined in the MIB file.

Syntax:

<object_ID>

Example:

1.3.6.1.4.1.7572.1.4.13

URLValue

No

The URL value of the trap variable defined in the MIB file.

Syntax:

<URL>

Example:

example.com

The following rules apply to the command syntax for Command and Remote Command actions:

Invoking command actions through ssh on Unix systems is supported. However, keep in mind that most Unix servers prompt for a password when ssh is used, which interrupts the command execution. Therefore, using ssh in command actions is not recommended.
"arg one" arg2
"arg \"one"
1
On the Action tab, in the Actions table, click the action name.
2
Observe the Type column of the row containing the parameter that you want to edit.
IMPORTANT: The Type column shows the parameter’s data type. When changing the parameter value, ensure that the value you specify matches that data type.
3
In the Action Parameters pane, in the row containing the parameter that you want to edit, click the Default link of that appears in the row’s Value column.
In the Variable tab, in the Registry Variables table, select the row containing the Foglight registry variable to which you want to set the parameter.
In the Variable tab, in the Rule/System Variables table, select the row containing the rule system variable to which you want to set the parameter. The list of available variables depends on the rule trigger type.
Open the User Defined tab and type a value for the action parameter.
5
Click Change.
The Action Parameter Editor dialog box closes and the Action Parameters table refreshes, showing the newly-modified parameter value in the Value column of the parameter’s row.
6
When you finish making changes to the action parameters, click Go to Action List to return to the list of actions.
The Actions pane refreshes, showing the newly-edited action.

In Foglight, Simple Network Management Protocol (SNMP) trap actions can be configured to forward alarms to an SNMP trap receiver. Trap definitions are specified in a Management Information Base (MIB) file. MIB files contain data structures that define the types of events that are being monitored and controlled.

Configuring SNMP trap actions assumes that you plan on sending SNMP traps from your monitoring environment to an external SNMP trap receiver. The process of forwarding SNMP traps is triggered by rules. This means that a rule that has an SNMP trap action assigned to it can cause Foglight to send an SNMP trap to a trap receiver when the rule’s condition is met.

There are several ways that you can use to configure SNMP trap actions. The simplest and probably most convenient way is to edit the Forward Alarms as SNMP Traps rule that is included with a core installation of Foglight.

This rule relies on the definitions of the MIB file, quest-foglight.mib. Both the Forward Alarms as SNMP Traps rule and the quest-foglight.mib file are included in the Send-SNMP-Trap-Action cartridge, deployed duringt he Foglight Management Server startup.

Figure 83. You can download the quest-foglight.mib file using the Components for Download dashboard.

This type of configuration involves editing the SNMP community string and the trap receiver’s IP address defined in the Forward Alarms as SNMP Traps rule. When configured, the rule sends traps that are formatted according to the settings specified in the SNMP trap action parameters. The rule contains an entering Send SNMP Trap Action with a set of pre-defined parameters that are compatible with the MIB file.

In addition to editing the SNMP community string and the trap receiver’s IP address, it is possible to define advanced SNMP settings, such as the trap target address or variable bindings using this rule. You can either edit, or copy and edit the Forward Alarms as SNMP Traps rule to meet your needs. Another option is to define SNMP traps in new or existing rules by adding an entering or exiting Send SNMP Trap Action to a rule, and edit the action’s parameters. This process typically requires advanced knowledge of the SNMP protocol and is beyond the scope of this guide. For more details, consult your SNMP documentation.

1
On the navigation panel, under Dashboards, choose Administration > Rules & Notifications > Rule Management.
2
On the Rule Management dashboard, locate the Forward Alarms as SNMP Traps rule entry.
3
Start editing the Forward Alarms as SNMP Traps rule. On the Rule Management dashboard, click the Rule column of the row containing the Forward Alarms as SNMP Traps rule.
4
In the menu, click View and Edit.
5
In the Confirm Edit Core Rule dialog box, click Continue
6
In the Rule Detail dialog box, in the upper-right corner, click Rule Editor.
NOTE: Some browser versions do not support the nested rendering of the Edit Rule page that you are about to access. If you are using those browser versions, click Launch in the display area, as prompted, to open the Edit Rule page in a new window or tab.
The Forward Alarms as SNMP Traps rule is a simple rule, which means that it only contains one state—Fire. The settings for the rule’s Fire state appear by clicking the Fire bar in the Conditions and Actions tab.
On the Conditions and Actions tab, click the Fire bar.
In the Fire pane, open the Action tab.
In the Action tab, in the Actions table, click the Send SNMP Trap Action entry.
10
Edit the CommunityString and TargetAddress action parameters.
Set the CommunityString parameter to contain your SNMP community string of the trap receiver. This test string acts as a password used to authenticate messages. For more information, refer to your SNMP documentation.
Set the TargetAddress parameter to the IP address of the trap receiving computer.
a
In the Action Parameters table, click the Value column of the parameter that you want to edit.
For example, to edit the CommunityString or TargetAddress parameters, in the row containing those entries, click its Value column (initially set to public and localhost, respectively).
The Action Parameter Editor allows you to reference registry or rule-level variables (Variable tab) or to specify a literal string (User Defined tab). The target address of the SNMP receiver and the SNMP community string are not referenced in any system or rule-level variables and do not change over time and are therefore specified as literal text string in the User Defined tab of the Action Parameter Editor dialog box.
b
Open the User Defined tab and type the SNMP community string (CommunityString parameter) or the SNMP trap receiver IP address (TargetAddress parameter), followed by clicking Change in the dialog box.
The Action Parameter Editor dialog box closes and the Action Parameters table refreshes, showing the newly-edited parameter after you edit a parameter value.
In the Edit Rule view, in the lower-left corner of the Condition and Actions tab, click Save All.

In some cases you may need to copy the severity-level variables and actions from an existing severity level of the same rule. Each severity level can have its own actions and severity-level variables.

While you edit rules, any unsaved changes to the severity-level variables or actions that you want to copy will be carried over to the destination severity. For example, if you edit an action for the Warning condition of a rule without saving it, and then proceed to copy that action in the Critical pane, the unsaved edits of the Warning action will be carried over to the Critical severity.

Copying severity-level actions and variables can be useful in situations when those definitions are identical or similar. Instead of writing and validating them for each severity level you can copy existing ones and modify them, if required.

1
Open the Conditions, Alarms & Actions tab.
2
On the Conditions, Alarms & Actions tab, open the Conditions tab.
The Condition tab appears in the display area.
a
Click Copy variables/actions.
The Condition tab refreshes.
5

You can associate a rule with an effective schedule or a blackout schedule. An effective period is a schedule during which you want a rule to be evaluated. For example, you might want to set your company’s hours of operation as the effective period for a rule.

You can also set blackout periods for a rule. A blackout is a schedule during which evaluation of the rule is suspended for set intervals. For example, you might want to set the times when regularly scheduled maintenance is performed on a server as the blackout period for a rule.

If a rule has no schedules associated with it, then it is always active. If you only add effective schedules to a rule, then it is automatically inactive at all times other than those specified by the effective schedules. Conversely, if you only add blackout schedules to a rule, then it is automatically active at all times other than those specified by the blackout schedules.

If you add both effective and blackout schedules to a rule, then it will be active only at the times specified by the effective schedules minus the times specified by the blackout schedules. This is because blackout schedules take precedence over effective schedules. For example, suppose you add two schedules to a rule: an effective schedule that runs Monday to Friday, 9 am to 5 pm, and a blackout schedule that runs every Tuesday from 10am to 11am. The rule will be active every Monday, Wednesday, Thursday and Friday from 9 am to 5 pm but will only be active from 9am to 10am and from 11am to 5pm on Tuesdays.

1
Open the Schedules tab.
b
Click Add on the right.
The Effective Schedules list on the right refreshes, showing the newly-added schedules.
b
Click Add on the right.
The Blackout Schedules list on the right refreshes, showing the newly-added schedules.
NOTE: Adding the Always entry to the list of blackout schedules does not create a black out for the rule. It has no effect on the rule’s blackout schedule.

Foglight allows you to configure rule behavior to ensure it does not fire repeatedly. Defining the behavior of rule alarms and actions can help you avoid being overwhelmed with alerts when a rule condition is met many times within a short period.

The following options are available:

Fire action if x consecutive evaluations are true. Sometimes, observations are high-strung, causing a single match in the evaluation to lead to more actions than desired. With this option it is possible to enforce a certain number of positive evaluations before a rule finally fires.
Setting this option to x causes the rule’s actions (simple and multiple-severity rules) and alarms (multiple-severity rules only) to execute when the number of evaluations defined by x are true.
Example: A rule that checks the current CPU utilization is evaluated every 5 minutes. To avoid having short spikes leading to a firing rule, you can configure a damper mechanism to prevent actions and alarms from occurring until a certain number of matches is reached, such as, for example, three consecutive evaluations. That means that three times in 15 minutes (because the rule is evaluated every five minutes) the evaluation has to resolve to true before the rule fires.
Fire actions if x out of y evaluations are true. Similar to the above setting, this option allows to enforce a pattern of the evaluation behavior. When the frequency of positive evaluations matters less than their reoccurrence, this option allows for a less strict damper mechanism.
Setting this option to x out of y causes the rule’s actions (simple and multiple-severity rules) and alarms (multiple-severity rules only) to execute after x out of y evaluations are true.
Example: A fixed number of positive evaluations in a row is not missing positives matches, however their pattern of 2-0-2-1-0-2 consecutive positive evaluations is not identified. Setting this option to 4 out of 8 allows for identification of a problem across multiple evaluations while not relying on them being consecutive.
Wait at least [hh:mm:ss] hh:mm:ss after first evaluation. Sometimes when evaluations are performed immediately after a topology object creation, or the Foglight Management Server re-start, a number of false positives can occur. There might be a startup-time factor or the monitored entity simply needs to calm down for a minute or two, before reliable analysis can be performed. This option specifies that the first evaluation and all evaluations in the given time frame afterwards are ignored before evaluation results are considered.
Example: When a new host becomes available online, a high network utilization is expected, while updates are downloaded or application synchronization commences. To avoid having newly-discovered hosts generate alarms on their bandwidth usage, you can specify a time window, for example, 15 minutes, during which the rule evaluating the network conditions is on hold.
1
Open the Behavior tab.

1:00

Yes

No

No

1:15

Yes

No

No

1:20

Yes

No

No

1:50

Yes

No

No

2:00

Yes

Yes

Yes

Foglight allows you to create flexible rules that can be applied to complex, interrelated data from multiple sources within your distributed system. You can associate several different actions with a rule, configure a rule so that it does not fire repeatedly, and associate a rule with schedules to define when it should and should not be evaluated.

Different types of data can be used in rules, including registry variables, raw metrics, derived metrics, and topology object properties.

There are two types of rules in Foglight: simple rules and multiple-severity rules. A simple rule has a single condition, and can be in one of three states: Fire, Undefined, or Normal. A multiple-severity rule can have up to five severity levels: Undefined, Fatal, Critical, Warning, and Normal.

Rule conditions are regularly evaluated against monitoring data (metrics and topology object properties collected from your monitored environment and transformed into a standard format). Therefore, the state of the rule can change if the data changes. For example, if a set of monitoring data matches a simple rule’s condition, the rule enters the Fire state. If the next set does not match the condition, the rule exits the Fire state and enters the Normal state.

A rule condition is a type of expression that can be true or false. When it evaluates to true, the rule is said to fire, causing any actions that are associated with the rule or severity level to be performed. You can configure a rule to perform one or more actions upon entering or exiting each state. When a multiple-severity rule fires, an alarm also appears in Foglight.

For more information see Configure Rules and Metric Calculations to Discover Bottlenecks .

The Foglight Management Server includes some built-in rules that monitor the health of your application server environment. Rules in this section:

NOTE: The Foglight Management Server also includes a rule that can be used to configure SNMP Trap Actions. For more information about this rule, see Forward Alarms as SNMP Traps rule.

Foglight includes two kinds of trap actions: SNMP Trap Actions and Send SNMP Trap Actions. Both trap action technologies are currently supported, however the Send SNMP Trap Action is a new version of trap actions, and is recommended by Quest over the use of SNMP Trap Actions.

Similar to SNMP Trap Actions, Send SNMP Trap Action can be configured using the Forward Alarms as SNMP Traps rule, described in this topic.

Both trap action technologies are currently supported, however Quest recommends the use of Foglight Trap Actions over SNMP Trap Actions.

This rule monitors the health of all agents in the monitoring environment. It generates an alarm if it finds an agent whose health is deteriorating (Warning) or is down (Critical).

Agent : agentID != "0"

An agent’s health is in decline

Warning

An agent is down

Critical

This rule sends all alarms from Foglight to the Service Discovery and Dashboards product.

The BSM All Events rule includes an entering BSM action which includes two mandatory action parameters: Alarm system event and BSM URL. These parameters must be set in order for the BSM rule to work properly. By default, Alarm system event is set to the alarmEvent rule-level expression, while the BSM URL action parameter points to the BSM URL Foglight registry variable. To ensure this rule works as expected, you need to configure the BSM URL Foglight registry variable to the destination address, followed by enabling this rule (it is disabled by default).

For more information about the Service Discovery and Dashboards, see the product documentation.

None

This rule monitors the credentials that have the Validity Window policy set. It fires when it finds any credentials that are about to expire.

CatalystServer

A credential is currently valid but is to expire in five days or earlier.

Warning

A credential is no longer valid.

Critical

This rule monitors the observations and generates an alarm if the Data Service starts discarding any observations. This can happen when the Foglight Management Server is overloaded, or when there is a difference, or the difference in the system time between the monitored system and the Foglight Management Server. This alarm indicates the server is overloaded and cannot keep up with the incoming data.

CatalystDataService

The Data Service discards one or more observations within a 15 minute interval

Warning

This rule monitors the size of the database, checking whether the database size is higher than the predefined threshold, set by the DBSMon.MaxDatabaseSize registry variable. By default, this value is set to 100 Gb. If required, you can increase this value.

CatalystDatabase

The size of the Foglight database exceeds 75% of the maximum database size.

Warning

The size of the Foglight database exceeds 90% of the maximum database size.

Critical

The size of the Foglight database exceeds 100% of the maximum database size.

Fatal

This rule checks the space that is currently available to the Oracle database against the thresholds defined in the Foglight registry. It generates alarms when the Oracle table space becomes too large. The thresholds for generating alarms are set by the following variables:

Database administrators should provide values for these thresholds in order to get notified when the database starts growing out of bounds.

CatalystTablespace

The size that is available to the Oracle database exceeds the threshold set by the DBSMon.WarningFreeTablespaceSize registry variable.

Warning

The size that is available to the Oracle database exceeds the threshold set by the DBSMon.CriticalFreeTablespaceSize registry variable.

Critical

The size that is available to the Oracle database exceeds the threshold set by the DBSMon.FatalFreeTablespaceSize registry variable.

Fatal

This rule periodically clears old LogFilter alarms.

None

This periodically looks for new agent instances that are connecting to the Foglight Management Server. It rebuilds the topology if it detects new agents.

CatalystServer

This rule directs all scheduled reports to their email recipients. A scheduled report can have one or more email recipients.

None

Checks whether the CPU count of an agent type exceeds the licensed number of agents. It generates a Warning alarm if it finds that the number of monitored hosts an agent is currently monitoring is higher than the number allowed by your license.

AgentTypeLicense

The number of monitored hosts is higher than the number allowed by the license.

Warning

This rule checks the amount of time the Foglight Management Server spends for garbage collection and generates alarms if that time exceeds pre-defined thresholds, defined by a set of registry variables for each severity state: Warning, Critical, and Fatal.

(CatalystServer).jvm.garbageCollectors where name not like '%copy%'

The amount of time spent on garbage collection exceeds the threshold set by the registry variable FMSMon.gcWarn. The default value of that variable is 10.

Warning

The amount of time spent on garbage collection exceeds the threshold set by the registry variable FMSMon.gcCritical. The default value of that variable is 30.

Critical

The amount of time spent on garbage collection exceeds the threshold set by the registry variable FMSMon.gcFatal. The default value of that variable is 90.

Fatal

This time-driven rule checks the validity of the current licenses, and generates alarms if it finds that a license is about to expire within a certain time period.

CatalystServer

A license expires in the number of days set by the LicenseExpirationDaysWarning registry variable. By default, this number is 30.

Warning

A license expires in the number of days set by the LicenseExpirationDaysCritical registry variable. By default, this number is 7.

Critical

A license expires in the number of days set by the LicenseExpirationDaysFatal registry variable. By default, this number is 2.

Fatal

This rule checks the memory that is available to the Foglight Management Server and generates a Critical alarm if the server is in danger of running out of memory, defined as 95% memory utilization. If this alarm is generated and cleared occasionally, this does not indicate any potential problems, however, if the alarm stays active without clearing, or if it is generated and cleared frequently, this indicates that you need to increase the memory allotment.

(CatalystServer).jvm

The amount of memory that is available to the Foglight Management Server exceeds 95% of the total memory usage.

Critical

Checks if any attempts to create topology objects are failing because the topology size limit has been reached. This number is defined by the foglight.limit.instances registry variable whose global default value is set to 10,000. You can change this value if required.

CAUTION: Increasing the default value of the foglight.limit.instances variable may cause performance issues on the Foglight Management Server. If you need to increase this value, contact Quest Support for further instructions.

The setting of this threshold protects against volatile, untuned topology models. This can be often caused by JavaEE Request URL tuning. If this rule fires, in most situations agent tuning is required to make the data less volatile.

CatalystTopologySizeConstraintService

The attempts to create topology objects are failing because the maximum number of topology objects exceeds the value set by foglight.limit.instances.

Warning

This is a template rule that can direct all incoming SNMP traps to an SNMP trap receiver, once the rule’s Send SNMP Trap Action parameters, CommunityString and TargetAddress are set to point to the desired SNMP trap receiver.

You can use this rule as a template when creating rules with SNMP trap actions. For more information about viewing the settings related to SNMP trap actions and their configuration in Foglight, see Configure trap actions .

None

This rule periodically checks whether there are any idle agents. An agent is considered idle if it is running but the Foglight Management Server does not register any data associated with that agent for a pre-defined period of time, defined by a registry variable for each severity state: Warning, Critical, and Fatal

Agent

The agent is idle for the number of hours set by the registry variable IdleAgent.Warning. The default value of that variable is 1.0 hours.

Warning

The agent is idle for a period of time set by the registry variable IdleAgent.Critical. The default value of that variable is 24.0 hours.

Critical

The agent is idle for a period of time set by the registry variable IdleAgent.Fatal. The default value of that variable is 168.0 hours.

Fatal

This rule checks whether at least one instance of the Foglight Agent Manager is running on a monitored host.

Host : detail instanceof RemoteClient

No instance of the Foglight Agent Manager on a monitored host.

Warning

Foglight monitors each service (either implicit or user-defined) for service level compliance. The ServiceLevelEvaluation – FMSServiceSLP rule checks the availability of each service and raises an alarm if the availability is lower than the a predefined threshold during a period of one hour.

FSMServiceLevelPolicy

An average availability during one hour period is below 95%.

Warning

An average availability during one hour period is below 85%.

Critical

An average availability during one hour period is below 70%.

Fatal

Manage Derived Metrics and Create Derived Metrics

Foglight allows you to control access to derived metrics. For each derived metric you can grant or deny read, write, or control access to roles or users. For more information about security concepts in Foglight, see Managing Users and Security.

Foglight employs the following behavior when it comes to permissions of derived metrics:

1
On the navigation panel, under Dashboards, choose Administration > Data > Manage Derived Metrics.
TIP: The Not Assigned icons in the Permissions columns indicate that the role has no permissions assigned to it.
b
In the dialog box that appears, use the Read, Write, and Control check boxes to assign permissions as required, and click Save.
The dialog box closes and the selected entry refreshes, showing three check marks in the Permission columns, one for each of the read, write, and control permissions.
TIP: Three check marks in the Permissions columns indicate that the role already has permissions assigned to it.
b
To edit permissions, ensure that Edit is selected and use the Read, Write, and Control check boxes as required.
c
Click Save.

Copying a derived metric is useful in situations when you need to quickly create a modified version of an existing derived metric. Instead of re-creating the metric’s expressions, simply copy a similar metric and edit its calculations.

If you have any derived metrics that are no longer referenced in rule conditions or derived metric expressions, you can delete them from the list. When a derived metric is deleted, all references to that metric in rule conditions and expressions become invalid. This may cause the rule to fail to evaluate. If this occurs, you must manually modify the rule condition or expression.

1
On the navigation panel, under Dashboards, choose Administration > Data > Manage Derived Metrics.
3
In the Copy Derivation dialog box, click OK.
In the Create Derived Metric view, in the Derived Metric Name box, type the name of the derived metric.
1
On the navigation panel, under Dashboards, choose Administration > Data > Manage Derived Metrics.
3
Click the Delete Selected button at the bottom.
4
In the Delete Derivation dialog box, click OK.
The Delete Derivation dialog box closes.

The Derived Metrics Diagnostics dashboard lists all derived metrics that exist in your environment, including the derived metrics available with the server and any installed cartridges. Use this dashboard to better understand how the existing derived metrics are being calculated and to debug any derivation-related problems.

For each rule, the Derived Metrics Diagnostics dashboard shows the following information:

Derived Metrics: The number of all derived metrics defined in your system.
Derived Metrics with Errors: The number of erroneous derived metrics.
Derivation Rulettes: The number of object instances to which the derived metrics are bound.
Derivation Rulettes with Errors: The number of erroneous derivation instances (rulettes).
Derivation Metrics without Rulettes: The number of derived metrics that are not bound to any object instances.
Name: The derived metric name.
Unit: The unit in which the derived metric is expressed, one of billion, billionth, bit, byte, celsius, count, day, exabyte, gigabyte, hour, kilobyte, megabyte, microsecond, million, millionth, millisecond, minute, month, nanosecond, percent, petabyte, revolution, second, terabyte, thousand, thousandth, trillion, trillionth, or year.
Scope: The derived metric scope. This can give you a better idea on the effect the derived metric has on your monitored system. The scope identifies one or more topology objects that the derived metric calculates. If the scope is not defined, the derived metrics runs against the entire data set which can have a negative effect on overall performance. A derived metric can be scoped to a topology type and can optionally be scoped to specific topology objects of that type. For more information, see Setting the rule or derived metric scope.
Rulettes: A rulette is a derived metric instance that represent the state of the monitoring object to which the derived metric expression applies. This column contains two sub-columns:
Count: The number of scoped objects to which the derived metric is bound.
In Error: The number of erroneous derivation instances (rulettes). Clicking this column shows a list of the object instances to which the error applies.
Cartridge: Identifies the cartridge in which the rule is defined, if applicable. For any rules that you create, this column is blank.
Name: The name of the cartridge in which the rule is defined, including the cartridges included with the server, and any installed cartridges. This column is empty for those rules that you create.
Version: The version of the cartridge in which the rule is defined, including cartridges included with the server, and any installed cartridges. This column is empty for those rules that you create.
Error: If a derived metric is in error, this is usually caused by one of its derived metric calculations being in error. Inspecting individual error messages associated with different derivation instances can often help you diagnose the problem. Start this flow by drilling down on the In Error column and then, in the dwell that appears, clicking the Error column, as described above.
Click the Error column on the Derived Metrics Diagnostics dashboard to open a dwell that contains additional information about the derivation.
Last Modified: The most recent date and time at which the derived metric was modified.

From here, you can drill down to a derived metric to see detailed diagnostics about that metric.

For more information about the Diagnostic Details view that appears, see View derived metric diagnostic details.

The Diagnostic Details view contains detailed run-time information about a selected derived metric. Use this view to determine which objects the derived metric is bound to and as a debugging tool to help you understand any derivation-related problems. Drill down to this view from the Derived Metrics Diagnostics dashboard.

This composite view contains the following embedded views:

Table 56. Top-Level View

Shows the derived metric definitions.

Name. The derived metric name.
Unit. The unit in which the derived metric is expressed, such as billion, billionth, bit, byte, celsius, count, day, exabyte, gigabyte, hour, kilobyte, megabyte, microsecond, million, millionth, millisecond, minute, month, nanosecond, percent, petabyte, revolution, second, terabyte, thousand, thousandth, trillion, trillionth, or year.
Value Type. A derived metric take over the form of the Foglight metric or an observation type. The range of available observations depends on the number of installed cartridges.
Cartridge. The name of the cartridge in which the derived metric is defined, including the cartridges included with the server, and any installed cartridges. This column is empty for those derived metrics that you create.
Cartridge Version. The version of the cartridge in which the derived metric is defined, including cartridges included with the server, and any installed cartridges. This column is empty for those derived metrics that you create.

Shows the derived metric calculations.

Scope. The derived metric scope. This can give you a better idea on the effect the derived metric has on your monitored system. The scope identifies one or more topology objects that the derived metric calculates. If the scope is not defined, the derived metrics runs against the entire data set which can have a negative effect on overall performance. A derived metric can be scoped to a topology type and can optionally be scoped to specific topology objects of that type. For more information, see Setting the rule or derived metric scope.
Expression. Contains the derived metric expression.
Trigger Type. The trigger type. This value affects the frequency at which Foglight processes the metric’s calculations. The trigger gives you a general idea of the metric’s activity. For example, a default data-driven trigger causes Foglight to process the metric’s calculations every time the data associated with the derived metric is collected. For more information, see Trigger derived metrics.
Error. If the derived metric has any errors associated with it, this column contains the error indicator.

Lists one or more object instances to which the derived metric is bound, and shows information about the derived metric activity, as it relates to each object instance. Selecting a table row shows additional details about the derived metric on the Last Evaluation Result Tab and Observations Tab.

Object. The name of the object instance used in the derived metric expression and its data type.
Enabled. Indicates if the object is enabled.
Error. If a derived metric instance has any errors associated with it, this column contains the error indicator.
Evaluations. The number of times the object instance was used in the derived metric calculation.
Reset Time. The date and time of the object’s most recent reset.
Last Evaluation. The date and time the most recent derived metric calculation took place.
Drill down on an entry in the Object column. Displays a dwell that shows the health of the object instance, identifies any agents or hosts related to this instance, and lists links to views that reference the object instance, including the Property Viewer and Metric Analyzer. From here, clicking a link under Related drills down to the selected view.
If a derived metric instance has any errors associated with it, the Error column contains the error indicator. Drill down on an error indicator. Displays a message that can help you diagnose the problem.

Shows the property values associated with the bound object instance.

Last Eval Result. Shows the most recent values of following object properties:
Sum of Squares: Sum of the squares of all metric values collected in the most recent sampling interval.
Standard Deviation: Standard deviation of all metric values collected in the most recent sampling interval.
Maximum: Maximum value of all metric values collected in the most recent sampling interval.
Count: Count of all metric values collected in the most recent sampling interval.

Shows information about the object to which the derived metric is bound.

Name. The name of the metric evaluated by the derived metric expression.
Object Name. The name of the object instance to which the derived metric is bound.
Object Type. The type of the object instance to which the derived metric is bound.
Drill down on an entry in the Observations table. Displays a dwell that shows the health of the object instance the metric is associated with, identifies any agents or hosts related to this instance, and lists links to views that reference the object instance, including the Property Viewer and Metric Analyzer. From here, clicking a link under Related drills down to the selected view.

The Manage Derived Metrics dashboard shows all of the derived metrics that exist in your monitoring environment. This includes the derived metrics that come with the Foglight Management Server and installed cartridges, and also any derived metrics that you create. From here, you can drill down to view the settings for a derived metric, and edit them, as required.

1
On the navigation panel, under Dashboards, choose Administration > Data > Manage Derived Metrics.
2
On the Manage Derived Metrics dashboard, click the Derived Metric Name column of the row containing the derived metrics whose definitions you want to view.
The Edit Derived Metric view shows the derived metric settings, such as the derived metric name, cartridge name and version (if applicable), modification date, and the derived metric calculations.
TIP: If a derived metric comes with the Foglight Management Server or any installed cartridge, the Cartridge Name and Cartridge Version values indicate the cartridge name and its version. Otherwise, if a derived metric is created using the Create Derived Metric dashboard, this value is blank.

A metric is a specific value that is measured over time. Many derived metrics come included with Foglight and installed cartridges, including activeAgentCount, availability, avg_inserts_per5min, and many others. If none of the existing derived metrics meet your needs, you can create a new one and add it to the derived metric collection.

There are many reasons for using derived metrics in your setup. First, derived metrics make the process of managing rules simpler. For example, using the same expression in multiple rules requires editing each expression when your requirements change. Instead, define a derived metric and edit its expression, instead of editing multiple conditions.

Derivation definitions also allow multiple scoping query/expression pairs under a single definition. For each topology object, the expression paired with the first scoping query which matches the object will be calculated. This allows you to override a derivation definition based on the scoping query where multiple derivations definitions exist.

Use the following guidelines to decide when to use one derivation with multiple scopes, or when to use multiple derivation definitions:

For example, you have a derivation freeMemory for topology type OS, with a subtype Unix that requires a different freeMemory calculation. Define a single derivation freeMemory create two scope/expression pairs (one for OS and the other for Unix).
For example, if you have a derivation freeMemory for the types OS and JVM, create two separate derivations to avoid coupling the definitions.

Derived metrics can also help you optimize performance by reducing the number of calculations that need to be performed at run-time. For example, if there are multiple rules that need to use the same complex metric expression in their conditions, creating a derived metric with this expression and using it in these rules’ conditions would have a positive impact on performance: the calculation specified in the metric expression would only need to be performed each time an instance of the derived metric is created instead of each time the rule is evaluated.

On the navigation panel, under Dashboards, choose Administration > Data > Manage Derived Metrics.
On the navigation panel, under Dashboards, choose Administration > Data > Create Derived Metric.
On the Create Derived Metric dashboard, in the Derived Metric Name box, type the name that you want to assign to the derived metric.

From here, you can proceed to Add calculations to derived metrics.

The scope of a derived metric defines the set of topology objects against which Foglight calculates it. A derived metric is scoped to a topology type and can optionally be scoped to specific topology objects of that type. If a derived metric is not scoped to specific objects, it applies to all instances of that type. You specify the derived metric scope using the query language. You can change the scope of a derived metric (the topology type or one or more specific topology objects of that type to which it applies) after its creation.

A derived metric can contain one or more calculations. Foglight processes derived metric calculations in the order they are listed, starting with the first one. Changing their order affects the behavior of the actions that are associated with the derived metric.

For example, if there are two calculations whose conditions evaluate to True, the first calculation takes precedence, causing one or more actions that are associated with that metric to be generated before the next one.

For detail information on how to scope a rule or derived metric to one or more topology objects, see Setting the rule or derived metric scope.

1
New derived metrics only. In the Derived Metric Calculations area, click Add Calculation.
2
Use the Derived Metric Scope and Expression areas to specify the scope of the derived metric.
Use one or a combination of the two Unit boxes under the Derived Metric Calculations list to specify the unit. Each box contains the following choices: billion, billionth, bit, byte, celsius, count, day, exabyte, gigabyte, hour, kilobyte, megabyte, microsecond, million, millionth, millisecond, minute, month, nanosecond, percent, petabyte, revolution, second, terabyte, thousand, thousandth, trillion, trillionth, and year.
For example, to set the unit o the derived metric to a number of days per month, click the left Unit box, and select day from the list that appears, then click the right Unit box and select month, as illustrated bellow.

From here, you can proceed to Trigger derived metrics.

An instance of a derived metric is created when its definition is triggered. A derived metric is configured to have one of the following triggers:

Schedule-Driven Derived Metric. A schedule-driven derived metric is evaluated based on an existing schedule. For more information about schedules, see Associate Metric Calculations with Schedules.
Enter and Exit. Causes the derived metric to be evaluated when the period defined by the schedule begins and ends.
Enter only. Causes the derived metric to be evaluated when the period defined by the schedule begins.
Exit only. Causes the derived metric to be evaluated when the period defined by the schedule ends.
Time-Driven Derived Metrics. A time-driven trigger causes the derived metric to be evaluated once per pre-defined interval.
Data-Driven Derived Metrics. If a derived metric has a data-driven trigger, it will be evaluated every time that data that is used in the expression for the derived metric is sent to the Foglight Management Server.
1
In the Expression area, under Trigger Type, select the Schedule Driven option.
Click Schedule and select a schedule from the list that appears.
Click Trigger Timing and select one of the following options from the list that appears: Enter and Exit, Enter only, or Exit only.
1
In the Expression area, under Trigger Type, select the Time Driven option.
1
In the Expression area, under Trigger Type, select the Data Driven option.

From here, you can proceed to Setting the derived metric type.

When you define the scope and trigger of the derived metric, you can specify the value type for the derived metric. The value type for a derived metric affects its appearance in dashboards. You can set the derived type to a metric, and specify its unit of measurement, or to an observation.

1
In the area immediately below the Derived Metric Calculations list, click Value Type and select Metric from the list that appears.
Use one or both of the Unit boxes on the left of Unit Type as required.
For example, percent or count / second.
1
In the area immediately below the Derived Metric Calculations list, ensure that both of the Unit boxes are blank.
Click Value Type on the right and select an observation from the list that appears.
Click Add (when creating a new derived metric) or Save (when editing an existing metric).

IntelliProfile

IntelliProfile evaluates collected data against the baseline, and compares incoming data for those metrics that have IntelliProfile threshold levels configured. Metric threshold states reflect the degree of deviation from the baseline, and can indicate potential performance bottlenecks. If there are any rule conditions that evaluate threshold states for such metrics, Foglight can generate alarms when a metric enters a certain threshold state.

The dashboard contains two views: General and Thresholds.

This view indicates the minimal number of hours allocated to IntelliProfile to process data, before generating the initial baseline. By default, this period is 24 hours. It also determines the length of time during which IntelliProfile retains collected data for its learning cycles. By default, this period is 90 days. Increasing this value results in larger storage requirements. Click to edit these values, as required. For more information, see Configuring the baseline.

This view shows the data ranges for Information, Warning, and Critical thresholds. Each data range has a minimum and maximum value pair that represents the percentage of expected average value. For more information, see Edit IntelliProfile thresholds.

The General view on the IntelliProfile dashboard shows the amounts of time allocated to IntelliProfile to process and retain data. Edit these values to suit your needs, as required.

1
On the navigation panel, under Dashboards, choose Administration > Data > IntelliProfile.
2
On the IntelliProfile dashboard that appears in the display area, in the General view, set the IntelliProfile is ready after first value. By default, this period is set to 24 hours.
3
Set the Allow IntelliProfile to automatically calculate the optimal based on the instance activity of the past value. By default, this period is set to 90 days.
4
Click Save Changes. The Save IntelliProfile dialog box opens.
5
Click Ok to close it.

The Thresholds view on the IntelliProfile dashboard shows the data ranges for the default threshold bounds. Each data range has a minimum and maximum value pair that represents the percentage of expected average value.

In a typical scenario, most data samples fall into the Information (baseline) data range, followed by data in the Warning and Critical ranges.

However, in some cases, threshold ranges do not follow this order. You may have, for example, the Critical threshold value level immediately after Information, followed by the Warning level. When the values overlap, certain levels can take precedents over others, depending on the order in which they are defined, and any overrides. For complete information, see Add bounds to threshold levels.

Cartridge developers can write rule conditions to examine if a metric entered a particular threshold state, and generate alarms. For example, if a memory usage metric enters a Warning state, you can write a condition that triggers a Warning alarm to alert end-users of a potential bottleneck:

Threshold level bounds are stored in the Foglight registry. You can edit them using the Thresholds view. The Threshold ranges listed on this view illustrate a default scenario in which the levels are listed in the incremental order relative to the baseline. Every threshold value points to a IntelliProfile registry variable that you can edit using this view.

IntelliProfile_Percentile1

1

IntelliProfile_Percentile2

3

IntelliProfile_Percentile3

5

IntelliProfile_Percentile4

95

IntelliProfile_Percentile5

97

IntelliProfile_Percentile6

99

Consider this list as a default mapping for those cases where threshold levels are maintained in incremental order from the baseline, which is the recommended configuration. However, the current server capabilities allow you to assign severities in a different order.

Editing these values updates the related variables, as indicated below. Edit these values to suit your needs.

1
On the navigation panel, under Dashboards, choose Administration > Data > IntelliProfile.
2
On the IntelliProfile dashboard that appears in the display area, in the Thresholds view, click and edit the values in the table.
3
Click Save Changes. The Save IntelliProfile dialog box opens.
4
Click Ok to close it.
相关文档

The document was helpful.

选择评级

I easily found the information I needed.

选择评级