Applies to
ApexSQL Monitor, ApexSQL BI Monitor, ApexSQL VM Monitor
Summary
This article explains how to manage alerts in ApexSQL Monitor.
Applies to
ApexSQL Monitor, ApexSQL BI Monitor, ApexSQL VM Monitor
Summary
This article explains how to manage alerts in ApexSQL Monitor.
Alerts notify you about potential and ongoing performance issues with your machines, virtual machines, SQL Server instances, SQL Server services, databases and many more. Alerts can be configured on a granular level for each monitored machine, device, SQL Server instance, database or any other monitored object.
All monitoring tools enable you to configure three alert threshold values: low, medium, and high, as well as the period for metric capturing. The default period for metric capturing is predefined by ApexSQL and it depends on the type of the metric. The minimal value for the time period is 1 s. Keep in mind that increasing this value can delay the metric collecting and make monitoring slower, while decreasing the value could improve precision but also severely increase the amount of data collected and thus impose additional load on the repository database and application.
Alerts are grouped into three categories, based on their severity. Each alert severity is indicated by its status color.
As alerting is configurable, all ApexSQL monitoring tools offer default values for the thresholds where applicable, but custom values can also be set.
If the metric has no default threshold values set due to the nature of metric (for example setting data and log file size thresholds for your databases may not make sense), the threshold values are shown as N/A.
Default threshold values are based on general recommendations and they might not apply to your monitoring goals and environment requirements. A huge number of alerts can be created, or some critical situations ignored if the thresholds are not adjusted to your specific environment.
By default, all ApexSQL monitoring tools enable alerting for the most important performance metrics. For the rest of the metrics, alerting must be enabled manually. Alerting can also be disabled for any of the metrics where alerting is enabled by default.
Enter the values for metric thresholds
Click the Save button above the configuration grid
Once alerting is set, it can be changed in the Configuration page, using the same steps followed for setting the alerts.
The Alert link in the main menu will open the Alerts page where the user can review alerts that have been raised on specific object depending on what is selected in the tree-view.
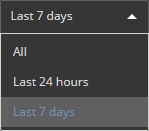
Displayed alerts are grouped by date and by default alerts for last 24 hours are displayed. User can change period for which alerts are displayed from the drop-down menu by selecting the last 7 days and All.
To display alerts for a specific period of time, select the custom dates checkbox and select the time period using the date/time pickers to define From and To date time for displaying raised alerts.
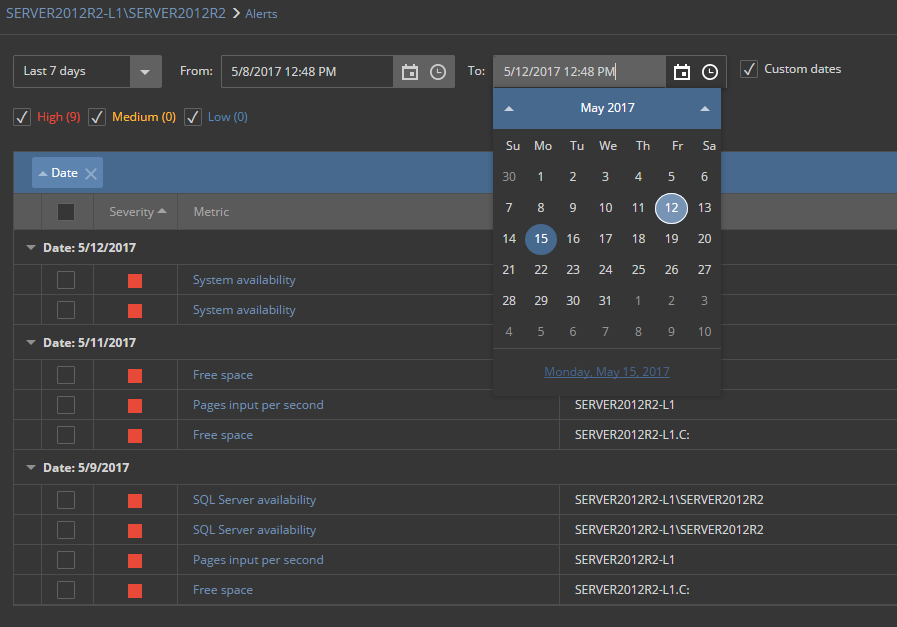
For each severity level, the number of raised alerts is shown next to the filter checkboxes. Select/unselect the alert severity filter checkboxes to filter out unwanted severity from the displayed list of alerts.
An alert remains active until it is resolved. After the alert is handled by a DBA it should be resolved.
To resolve multiple alerts at once, select the adequate check boxes in the grid and click the Resolve button above the grid.
To resolve individual alert with more details including the comments, select the specific alert name. This will open the details page for that alert. Here the alert can be resolved using one of the offered resolutions: Ignored, Fixed, Known issue. The Not resolved option is here to provide information that alert is reviewed but no solution was found yet
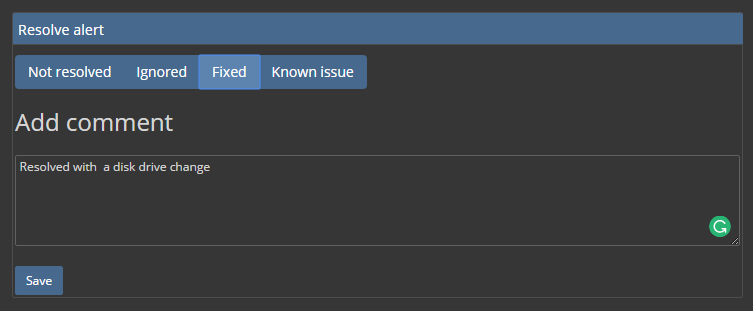
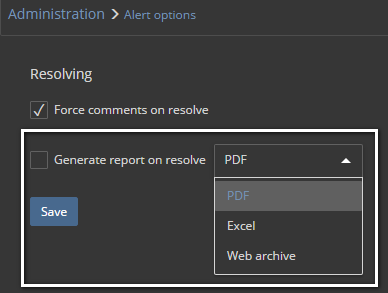
Also, the comment for resolved alert is obligatory by default. This can be changed in the Administration → Alert options page by unchecking the Force comments on resolve checkbox
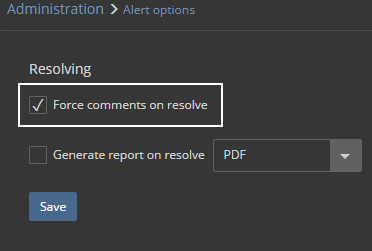
By selecting the Generate report on resolve and selection one of the offered report format (PDF, Excel or Web archive), report will be automatically generated for resolved alert and offered to be saved in the file system
The application will generate a new alert when the metric reached its predefined value again.