The Result Sets tab displays a data grid for executed SQL statements and scripts that return data.
If you occasionally closed the Results pane, you can restore it by selecting Editor | Windows | Script Results.
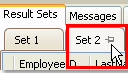
You can easily review all (or the selected Result sets) in one Result Sets tab. Left-click and hold Shift or Ctrl to select more than one Result sets of your script. Select All results to review all in one tab.
To enable view of all Result Sets in one Tab
 in the lower left corner of the grid, and then click OK on the window that displays. You do not need to edit fields in this window.
 |
To... |
Do this... |
|---|---|
|
Pin a result set so it is not overwritten by a subsequent query in the Editor or Query Builder. |
Click the push pin beside the result set:
|
|
Set the value of a cell to null. |
Press CTRL+DELETE. |
|
Toggle between the Editor and Data Grid. |
Press F6. |
| Add column or group summary values |
Right-click the data and select Show | Summary Footer Panel. Then, right-click the Summary Footer Panel below the column you want to add a summary total to and select an option. If you have grouped columns using the Grouping panel (Show | Group Panel), you can also add a summary total to grouped records. |
|
Apply a summary function to the data (Sum, Min, Max, Count, Avg). |
Right-click below the column you want to apply the summary function (but above the Navigation toolbar) and select an option. |
|
Show or hide columns of data. |
Right-click a column heading in the data grid and select Column Chooser. |
|
Display data in a report, pivot grid, or chart. |
Right-click the data and select Send To |<option>. |
|
Compare differences between two data sets. |
Right-click the data and select Compare To. |
|
Display the data in a grid or card view; grid view is useful for viewing summary information at a glance; card view is useful for viewing information in greater detail. |
Right-click a record and select Show |Grid View or Card View. |