Chat now with support
Chat with Support

SQL Optimizer for SQL Server 10.1 - Whats New

New in This Release

SQL Optimizer for SQL Server® 10.1

Wednesday, August 15, 2018


SQL Optimizer for SQL Server 10.1

This release of SQL Optimizer for SQL Server is a minor release and includes resolved issues and minor enhancements.

SQL Optimizer for SQL Server 10.0.3

SQL Optimizer 10.0.3 is a minor release and includes the following enhancements.

SQL Server 2016 Support

This release includes support for Microsoft SQL Server 2016.

  • Added support for query hints, MAX_GRANT_PERCENT and MIN_GRANT_PERCENT, for SQL Server 2016.
  • Added support for the new query hint, NO_PERFORMANCE_SPOOL, for SQL Server 2016.
  • Added support for the new query hint argument, USE HINT, in SQL Server 2016 SP1.
  • Added support for the table hint, SNAPSHOT, introduced in SQL Server 2014.

SQL Optimizer for SQL Server 10.0.1

SQL Optimizer for SQL Server 10.0.1 is a maintenance release and includes primarily resolved issues.

SQL Optimizer for SQL Server 10.0

Find SQL

Search Results

The Find SQL module now includes a new dashboard-style summary page for search results.

  • SQL Optimizer displays the new dashboard-style page immediately after the search process is finished.
  • When you open a saved session, the dashboard displays for easy navigation to results details.
  • The dashboard displays a summary of results from your search. Results are grouped by resource consumed and by SQL location (SQL, batches, or database objects).
  • Click a pie chart to open Top SQL, Top Batches, or Top Database Objects and quickly drill down to result details.

  • This new dashboard-style page allows you to:
    • See a summary of all results on one page.
    • See a side-by-side comparison of resource utilization for the most resource-intensive SQL.
    • Easily compare other resources consumed by the selected SQL.
    • Easily compare resource consumption at SQL Batch and Database Object levels.
    • Go directly to a results page already filtered by resource consumed or SQL location (click the pie chart of interest).
  • The dashboard displays a summary of results based on statistic totals (not averages).
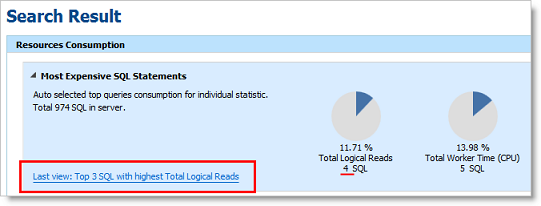
  • The number of SQL used in each pie chart is the Top n SQL suggested by SQL Optimizer. Click a pie chart to open the Summary Chart where you can adjust this number to fine-tune your view.
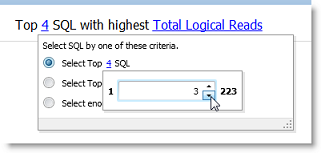
  • Use the dashboard page to easily navigate between results views. This page also remembers your last view.
SQL Classification

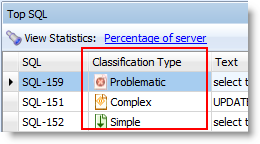
Find SQL also conveniently groups the collected SQL statements into SQL Classification categories (problematic, complex, simple, and invalid).

  • The dashboard displays a color-coded pie chart that helps you visualize the percentage of SQL statements in each classification category. The legend lists the number of SQL in each category.

  • Click a color-coded category in the pie chart to open the SQL by Classification page displaying the list of SQL statements in that category. Select a statement to view SQL text, execution plan, and batch or database object.

Summary Chart View

  • You now click View Details to see the SQL details for Top SQL, Top Batches, or Top Database Objects.

  • Each Summary Chart view now includes a Classification Type column in the SQL grid.
SQL Details View

The Details page has been redesigned to make it easier to view and compare SQL details.

  • The list of SQL and the details are now on the same page. Scroll through the SQL list to quickly view details of each SQL and see how the SQL relate to each other.
  • When viewing details, you can now display the SQL text highlighted within the context of the batch or object.

  • When viewing results by batch/object, expand the batch/object node to see the list of SQL in that batch/object. Select a SQL statement to see its details.
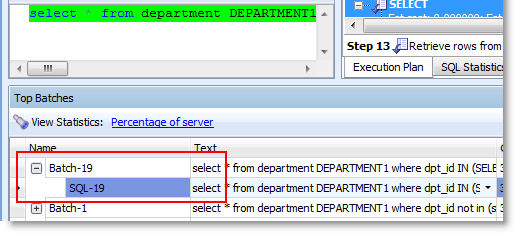
  • In the Details view for Top SQL, select a SQL statement and drill down to see batch or object details.

Optimize SQL

Test Run Function

New Test Run buttons replace the Execute and Batch Run buttons. Each button includes new sub-commands with slightly different functionality. These buttons have been redesigned to streamline the test run process. (To specify the number of records to retrieve and the number of times to test run alternatives, use the Test Run Settings dialog or the Test Run Special Settings dialog.)

  • A new Test Run Current group button replaces the Execute button.

    • Click Test Run - Current to test run a single alternative.
    • Click Test Run Special - Current to test run a single alternative and specify test run options.
  • The Test Run All group button replaces the Batch Run button. This new button includes the Test Run - All and Test Run - Selected commands to test run all alternative or a selected group of alternatives simultaneously. Use the Test Run Settings dialog to specify other options.

  • The Batch Run All/Selected Multiple commands have been removed. To test run SQL multiple times, use the Test Run Settings dialog.
  • The Auto Optimize button is no longer a group button. Click Auto Optimize to rewrite the original SQL and test run all alternatives. Use the Test Run Settings dialog to specify other options.

Test Run Settings Dialog

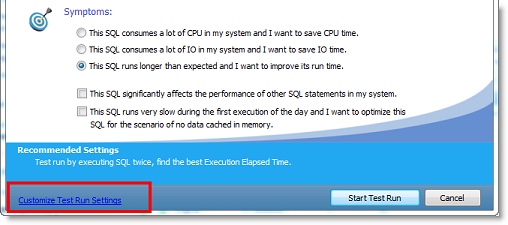
A new Test Run Settings dialog replaces the Session Batch Run Criteria dialog. This dialog opens when you select Test Run - All or Test Run - Selected.

This new dialog streamlines the process of selecting test run options.

  • Simplify the process of selecting test run settings by answering three questions about your original SQL. SQL Optimizer automatically determines the best test run settings based on your answers.

  • If you prefer, you can specify test run settings manually by selecting the Customize Test Run Settings link at the bottom of the page. The Custom Setup page opens where you can specify detailed options for your test run.
  • Several of the test run options have been refined to better help you identify the best SQL alternative.
    • When using the termination option User-defined time, you can select whether or not to terminate the original SQL if it is included in the batch.
    • When using the termination option Percentage of original SQL run time, you can select whether or not to run the original SQL again if it is not included in the batch.
    • The termination option Run time of the fastest SQL now applies to the fastest SQL in the batch, not all alternatives.
  • Flush data cache before running each SQL is now the default selection.
  • You can now apply a label to a test run to identify all alternatives that were executed in that test run. The label is displayed in the Test Run Label column in the Alternatives or Plans grid. Use the default timestamp or create a custom label.

Test Run Special Settings Dialog

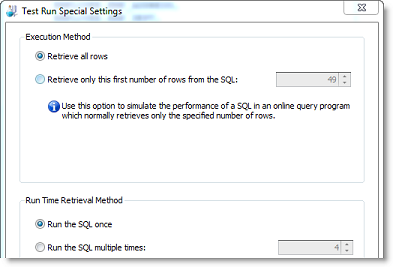
You can now specify test run options when you test run a single SQL or plan alternative.

  • Select the Test Run Special - Current option to test run the alternative. The Test Run Special Settings dialog opens where you can specify the number of records to retrieve and the number of times to test run the alternative.
Execution Statistics

  • The following statistics are now included in the Alternatives pane and the Plans pane in Optimize SQL: Response Time, Writes, Buffers Received, and Bytes Received.

Linked Server Objects

  • The Schema Information tab now identifies a table or view from a linked server by displaying Remote Table or Remote View in the Type field.

Syntax Support

  • SQL Optimizer now supports SQL Server "linked servers" and queries that utilized linked servers.
  • This release includes support for SQL Server synonyms.


Self Service Tools
Knowledge Base
Notifications & Alerts
Product Support
Software Downloads
Technical Documentation
User Forums
Video Tutorials
RSS Feed
Contact Us
Licensing Assistance
Technical Support
View All
Related Documents
SQL Optimizer for SQL Server - 10.1
Installation Guide
Release Notes
User Guide
Whats New
Showing 1 to 4 of 4 rows

The document was helpful.

Select Rating

I easily found the information I needed.

Select Rating