Note: Available for Oracle 10.2 and later.
To open the Average Time page
Average Time (ms) versus Time shows how the average time taken for events in the selected category will change between now and the end-date.
Note: This rate is for ALL events in the selected category.
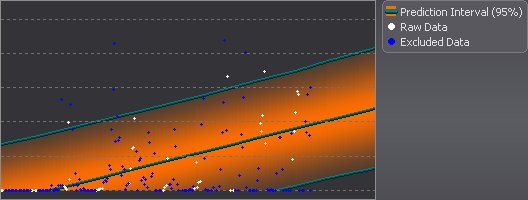
The example chart shows an Average Time chart for a bottleneck prediction where a Peak Activity filter has been specified in Peak Processing Periods. Peak Processing Periods
Chart data points
| Data Points | Description |
|---|---|
| The raw data ( |
The actual data used to generate the chart. |
| The excluded data (blue data points) | The data that was ignored because it fell outside one of the Peak Processing Periods. |
| New data (in a contrasting color) | New data (when available) is data collected AFTER the raw data was analyzed. |
| The shaded region | The Prediction Interval that is based on the raw data. |
| A vertical trend change line |
If displayed, it shows the early data follows a different trend from the more recent data. Trend Changes The early data is not used in making predictions. Note: You can set a Trend Change line via the chart toolbar. |
Chart toolbar
| Toolbar | Description |
|---|---|
|
Add Trend Change |
Mark trend changes on the Predictive Diagnostics chart. In the Add Trend Change window:
|
|
Delete Trend Change |
Remove trend change lines from the chart. In the Delete Trend Change window, select the Delete? option that corresponds to the line you want to remove. |

Accept suggested trend change |
If Predictive Diagnostics notices a possible trend change it will mark it on the chart and prompt you to accept or reject it. |

Reject suggested trend change |
|

Display Excluded Data |
Show data that was ignored because it fell outside one of the Peak Processing Periods. |
|
Reanalyze |
Generate a new Prediction Interval on the chart from the raw data. |
You can mark a trend change on the chart wherever you like, but the trend change is valid only in circumstances where it represents a REAL change in Oracle's handling of SQL statement executions, system bottlenecks, or database resources.
Note: Trend changes in Impending Bottlenecks and Performance Modeling (and their sub-pages) apply globally to ALL the time-based charts for timed statistics and database resources. A bottleneck or resource ceiling is likely to be a feature of the system itself and NOT depend specifically on the transactions in progress or the timed statistics used to analyze the system.
The Bottleneck Impact for the selected category contains this information:
Note: The text in this control may contain one or more hyperlinks to additional information available from the Oracle Community at Toad World.


