Chat now with support
Chat with Support

Spotlight on Oracle 10.10 - Release Notes

Zoom in on Charts

The Zoom (applied to the horizontal and vertical axes of the chart) determines the scale.

You can zoom in on a section of a chart using one of the following methods:

Action Description

Use the magnifying glass

  1. Click the magnifying glass.
  2. Move the mouse pointer over the chart. (The pointer changes to a magnifying glass.)
  3. One of the following:
    • Click on the chart. This centers the view on the chosen point and doubles the current zoom factor.
    • Click-and-drag the mouse to enclose the area that you want to magnify. The chart zooms to the size of the enclosed rectangle when the mouse button is released.

Notes:

  • To return the chart to its default size, right-click on the chart and select Unzoom.
  • To switch temporarily from Zoom mode to Pan mode, hold down the Ctrl key.
  • To zoom out, hold down the Shift key while clicking on the chart. This centers the view on the chosen point and halves the current zoom factor.

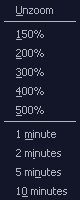
Use the drop-down menu

  1. Click the down arrow next to the magnifying glass to open the drop-down menu.
  2. Click a percentage option to zoom the chart horizontally AND vertically by that percentage

    –or–

    Click a time option (where applicable) to zoom the horizontal axis of the chart to the specified time period, while resetting the vertical axis to the default value.

Note: Time options are not available in chart views without a time axis (bar charts, for example).

Notes:

  • You cannot zoom a Pie chart.
  • When the chart is zoomed so that not all of a chart can be seen at the one time, the chart also displays scrollbars that allow you to choose the visible portion of the chart. Pan Over Zoomed Charts


Related Topics

Related Documents

The document was helpful.

Select Rating

I easily found the information I needed.

Select Rating