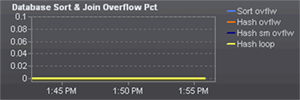
The Database Sort & Join Overflow Percent graph relates the number of sort and hash join overflows to the total number of sorts and hash joins, respectively, performed in the database. These ratios, expressed as percentages, are determined for the database over consecutive monitoring intervals and are shown in the following series:
Sort ovflw —Plots the percentage of sort overflows per monitoring interval. (This percentage is based on the ratio of sort overflows to total sorts completed.)
Hash ovflw —Plots the percentage of hash joins that encountered insufficient sort heap per monitoring interval. (This percentage is based on the ratio of hash joins that overflowed to total hash joins completed.)
Hash sm ovflw —Plots the percentage of hash join overflows in which the sort heap was short by ten percent or less (per monitoring interval).
Hash loop —Plots the percentage of hash joins that had to resort to a less efficient algorithm because the sort heap allocated lacked sufficient space to use the standard, high-performance hashing technique. (This percentage is based on the ratio of hash join loops to total hash joins.)
The bottom of the graph shows the sum of all sort heap allocations for the database during the last monitoring interval. This number can exceed the SHEAPTHRES database manager configuration parameter.

You should investigate any sustained overflow activity. While adjusting the SORTHEAP and SHEAPTHRES parameters is a way to reduce sort overflows and hash loops, you should also investigate application SQL that might be causing less-than-optimal sorts and hash joins:
Use the Appl Sort & Hash Join and the Appl Sort & Join Overflow Pct graphs on the Sorting tab in the Client Application Analysis drilldown to identify the applications that are generating the overflows and hash loops.
Use the Top SQL drilldown to identify offending SQL statements within these applications.