Chat now with support
Chat with Support

Foglight for SQL Server (Cartridge) 5.9.4.20 - User Guide

Introduction to this Guide Using Foglight for SQL Server
Viewing the Databases Dashboard Overview Dashboard Advisories Dashboard Monitoring Data Replication Monitoring SQL Performance Reviewing Memory Usage Reviewing the Instance Activity Reviewing Database Usage Reviewing the Services Using the HADR Drilldown Using the Logs Drilldown Reviewing Configuration Settings Viewing User-defined Performance Counters and Collections
Monitoring Business Intelligence Services Administering Foglight for SQL Server
Configuration Settings Managing Foglight for SQL Server Agent Settings Reviewing Foglight for SQL Server Alarms Generating Reports Monitoring SQL Server instances on VMware servers
Glossary
A
Access methods Adhoc SQL Plans Alarm Alert Allow updates Anonymous subscription Authentication AutoClose AutoGrow Automatic Discovery AutoShrink B Batch BCP (Bulk Copy Program) Blocking Books Online Bound trees Buffer Buffer cache Buffer pool Bulk copy Bulkinsert Bulk load C Cache CAL Calibration Cardinality Cartridge Chart Checkpoint process Client network utility CLR Compile Connect Connection Connectivity software CPU Usage Cursors D Data access components Data file Data storage engine Database Database object DataFlow DBCC DBID DBO Deadlock Disk queue length Disk transfer time Disk utilization DiskPerf Distributing instance Distributor DMO Drilldown DTC DTS E Error log Event alert Execution contexts Extended stored procedures Extent External procedures F File Filegroup File cache Foglight Agent Manager Foglight Management Server Foreign key Forwarded records Free buffers Free list Free pages Free potential Free space Freespace scans Full text search G GAM Ghosted records Growth increment GUID H Hash buckets Hashing Heap Hit rate Hit ratio Host name Host process I I/O Index Indid Integrated security Intent Locks J Job K Kernel memory Kernel mode Kill L Latch Lazy writer Licensing Lightweight pooling Lock Lock area Lock escalation Lock mode Log Log cache Log writer Logical I/O LRU LSN M Master MaxSize MDAC Metric Misc.normalized trees Model Monitor page file N Named pipes Net library NIC Null O OBID Object plans OLAP OLAP service OLTP Optimizer Optimizer cache osql P Page life expectancy Paging Panel Parse Parser Per seat licensing Per server licensing Performance alert Physical I/O Physical read Physical write PID Pinned Plan Plan cache Potential growth Prepared SQL plans Primary key Privileged mode Procedure cache Procedure plans Process Profiler Publication database Publisher Publisher databases Publishing server Pull subscription Pulse Push subscription Q Query plan R RAID Random I/O Read ahead Recompile Referential integrity Relational data engine Replication procedure plans Role Rollback S sa Schema locks Sequential I/O Session Severity SGAM Shared locks Show advanced options SMP Sort, Hash, Index Area SPID Spike Spinner SQL Agent Mail SQL Mail SQL Plans SQL Server Agent SQL Server authentication SQL Server books online Standard deviation Stolen pages Stored procedure Support service SYSADMIN role T TDS TempDB Temporary tables and table variables Threshold Torn page detection Transaction Trigger Trigger plans Truncate Trusted U UMS Unused space User connection area User mode V Virtual log file VLF W Waitfor Windows authentication mode Working set
Reference
SQL PI Repository Cold Backup Procedure SQL Performance Investigator Metrics
Active Time All SQL Agents CPU Usage All SQL Agents Resident Memory Usage Availability Average Physical I/O Operations Average SQL Response Time Backup Recovery Wait Blocked Lock Requests Checkpoint Pages CLR Wait CPU Usage CPU Wait Cursor Synchronization Wait Database Replication Wait Deferred Task Worker Wait Degree of Parallelism Disk Utilization DTC CPU Usage DTC Resident Memory Usage Distributed Transaction Wait Executions Ended Executions Started External Procedures Wait Full Scans Full Text Search CPU Usage Full Text Search Resident Memory Usage Full Text Search Wait Free Buffer Wait Hosted Components Wait IO Bulk Load Wait IO Completion Wait IO Data Page Wait IO Wait Latch Buffer Wait Latch Wait Latch Savepoint Wait Lazy Writes Lock Wait Lock Bulk Update Wait Lock Exclusive Wait Lock Intent Wait Lock Requests Lock Schema Wait Lock Shared Wait Lock Update Wait Lock Wait Log Buffer Wait Log Flushes Log Other Wait Log Synchronization Wait Log Wait Log Write Wait Memory Wait Network IO Wait Network IPC Wait Network Mirror Wait Network Wait Non SQL Server CPU Usage Non SQL Resident Memory Usage OLAP CPU Usage OLAP Resident Memory Usage OLEDB Provider Full Text Wait Other CPU Usage Other Miscellaneous Wait Other Wait Overall CPU Page Life Expectancy Page Splits Parallel Coordination Wait Physical I/O Physical Memory Used Physical Page Reads Physical Page Writes Probe Scans Plan Cache Hit Rate Range Scans Rec Ended Duration Remote Provider Wait Run Queue Length Samples Service Broker Wait Session Logons Session Logoffs SQL Agent CPU Usage SQL Agent Resident Memory Usage SQL Executions SQL Mail CPU Usage SQL Mail Resident Memory Usage SQL Recompilations SQL Response Time SQL Server Background CPU Usage SQL Server Cache Memory SQL Server Connections Memory SQL Server Connections Summary SQL Server Foreground CPU Usage SQL Server Resident Memory Usage SQL Server Swap Memory Usage Synchronous Task Wait Table Lock Escalation Target Instance Memory Total CPU Usage Total Instance Memory Virtual Memory Used
Rules Collections and Metrics
SQL Server Agent's Default Collections Access Methods Agent Alert List Agent Job List Always On Availability Groups Backup Locations Blocking History Blocking List Buffer Cache List Buffer Manager CLR Assemblies Cluster Summary Configuration Database Index Density Vectors Database Index Details Database Index Fragmentation Info Database Index Histogram Database Index List Database Information Database Properties Database Sessions (Session List) Database Summary Database Tables List Databases Deadlock DTC Information Error Log Error Log List Error Log Scan File Groups File Data Flow Statistics File Groups Files Files Drive Total Files Instance Summary Full Text Catalog InMemory OLTP (XTP) Instance Wait Categories Instance Wait Events Job Messages Latches and Locks Lock Statistics Locks List Log Shipping Log Shipping Error Logical Disks Memory Manager Mirroring Mirroring Performance Counters Missing Indexes Plan Cache Distribution Plan Cache List Replication Agents Replication Agent Session Actions Replication Agent Session Merge Articles Replication Agent Sessions Replication Agent Sessions by Type Replication Available Replication Publications Replication Subscriptions Reporting Services Resource Pool Session Data Session Trace SQL PI Instance Statistics SQL Server Connections Summary SQL Server Global Variables SQL Server Host SQL Server Load SQL Server Services SQL Server Throughput SQL Server Version Info SSIS OS Statistics SSIS Summary Statistics Top SQLs Top SQL Batch Text Top SQL Long Text Top SQL Plan Top SQL Short Text Top SQL Summary Traced SQL PA Usability User-defined Performance Counters User-defined Queries Virtualization XTP Session Transactions Statistics

Advisories Dashboard

The Advisories dashboard is provided to continually analyze application performance to identify performance inefficiencies, to guide you through problem resolution strategies, and to deliver a step-by-step action plan for maximizing database performance.

The upper section of the Advisories dashboard includes general information on the monitored instance:

The lower section of the Advisories dashboard contains the following two elements:

Action Plan: Summarizes available advisories that present opportunities to increase the overall performance of your database.
Advisories: Lists advisories, action types, and the relevant descriptions. Click each advisory to view detailed analysis results, a complete description of the recommended action to be taken, and the background information of this tuning area.

Refer to the table below for the Lists of advisories and short descriptions of their purpose:

General terms used in the Advisory List:

Indicates that the database system’s performance during the specified time frame, exceeded the normal rate relative to a calculated baseline. Deviations outside the baseline range suggest abnormal or unexpected activity and should be investigated to determine whether they suggest a performance problem.

Analyzed every 1 hour.

Indicates that the total instance CPU usage exceeded the baseline. Deviations outside the baseline range suggest abnormal or unexpected activity and should be investigated to determine whether they suggest a performance problem.

Calculated every 1 hour.

Indicates that the total time spent waiting for I/O requests to finish, exceeded the baseline. I/O wait includes both waits for physical I/O operations and logical I/O (waits to read from the buffer pool). Deviations outside the baseline range suggest abnormal or unexpected activity and should be investigated to determine whether they suggest a performance problem.

Analyzed every 1 hour.

Indicates that the total time spent waiting on various wait types related to Memory, exceeded the baseline. Deviations outside the baseline range suggest abnormal or unexpected activity and should be investigated to determine whether they suggest a performance problem.

Calculated every 1 hour.

Indicates that the total time spent waiting on various wait types related to Network, exceeded the baseline. Deviations outside the baseline range suggest abnormal or unexpected activity and should be investigated to determine whether they suggest a performance problem.

Analyzed every 1 hour.

Indicates that the total time spent waiting for locks to be released, exceeded the baseline. Deviations outside the baseline range suggest abnormal or unexpected activity and should be investigated to determine whether they suggest a performance problem.

Calculated every 1 hour.

Indicates that the total time spent waiting on various wait types related to Latch, exceeded the baseline. Deviations outside the baseline range suggest abnormal or unexpected activity and should be investigated to determine whether they suggest a performance problem.

Analyzed every 1 hour.

Indicates that the total time spent waiting on various wait types related to Log, exceeded the baseline. Deviations outside the baseline range suggest abnormal or unexpected activity and should be investigated to determine whether they suggest a performance problem.

Analyzed every 1 hour.

Indicates that the total time spent waiting on various wait types related to CLR, exceeded the baseline. Deviations outside the baseline range suggest abnormal or unexpected activity and should be investigated to determine whether they suggest a performance problem.

Calculated every 1 hour.

Indicates that the time spent waiting on various wait types related to Remote Provider, exceeded the baseline. Deviations outside the baseline range suggest abnormal or unexpected activity and should be investigated to determine whether they suggest a performance problem.

Analyzed every 1 hour.

Indicates that the total time spent waiting on waits categorized as “Other”, exceeded the baseline. Deviations outside the baseline range suggest abnormal or unexpected activity and should be investigated to determine whether they suggest a performance problem.

Analyzed every 1 hour.

Indicates that the total time spent waiting on waits related to in-memory OLTP, exceeded the baseline. Deviations outside the baseline range suggest abnormal or unexpected activity and should be investigated to determine whether they suggest a performance problem.

Analyzed every 1 hour.

Table Experiencing Lock Contention

The advisory highlights tables and indexes that are in the source of lock issues affecting the instance. It helps to identify the objects in question, analyzes the effect of locks on the entire system, and provides details to resolve them.

Analyzed every 1 hour.

Deadlock Observed

The advisory is raised when the number of deadlocks per minute is bigger than 1. It includes details about the database, application, and objects that were involved in the deadlocks occurred.

Analyzed every 1 hour.

Excessive Statements Re-compiles

The advisory is raised when the rate of recompiles compare to the amount of batches during the analyzed period is bigger than 10% and instance is CPU bound.

Analyzed every 1 hour.

Buffer Latch Contention

The advisory is raised when the amount of waits for buffer latch is more than 10% of instance activity. It provides recommendations on how and what to tune to reduce it.

Analyzed every 1 hour.

Excessive Memory Pressure

The advisory is raised when Foglight detects various symptoms that indicate memory pressure exists. It provides details on what those symptoms are and recommendations on how to fix it.

Analyzed every 1 hour.

Excessive Log Wait

The advisory is raised when the amount of waits related to transaction log is more than 20% of instance activity. It provides recommendations on how and what to tune to reduce it.

Analyzed every 1 hour.

Excessive I/O Wait

The advisory is raised when the amount of waits related to physical I/O is more than 5% of instance activity. It provides information about top statements consuming this I/O and details about missing indexes that may contribute to the situation.

Analyzed every 1 hour.


Monitoring Data Replication

If the monitored SQL Server environment contains one or more instances that are configured as distributors (distributing instances) in a replication operation, Foglight for SQL Server now provides a replication monitoring module.

The Replication Available flag indicates if an instance is configured as a distributor in these ways:

Upon the configuration as a distributor for monitored instances. Instances detected as distributors appear with the button Go to the Replication Home Page () next to the Show quick view button on the Name column of the Databases table.

The replication home page can be accessed using one of the following methods:

Click the button Go to the Replication Home Page.
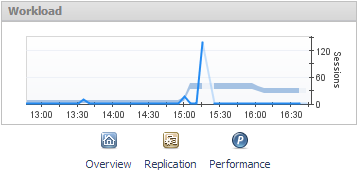
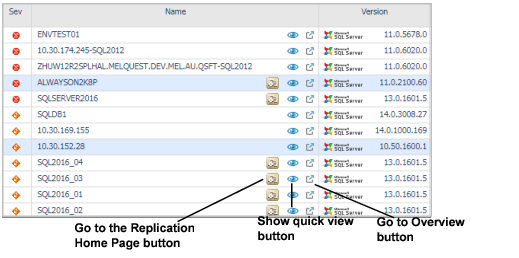
Click the Replication button on the QuickView panel.
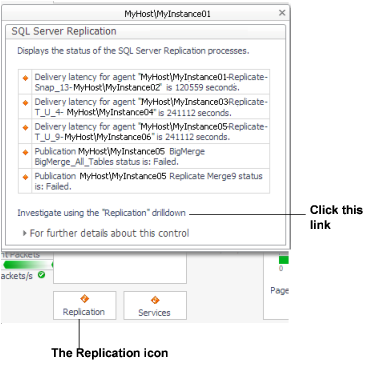
Click the link Investigate via Replication dashboard in the SQL Server Replication pop-up, which appears when you click the Replication icon under the Background Processes section of the instance's home page.

Viewing the Replication Home Page

The table identifies the main elements of the Foglight for SQL Server Replication Home page window, and provides a link to display more information, corresponding to the logical dataflow within the Replication Home page.

Replication-related alarms

Monitoring Alarms

Publications drilldown

Monitoring the Replication Publications

Agents drilldown

Monitoring the Replication Agents

Subscriptions drilldown

Monitoring the Replication Subscriptions

Publishing pane

Reviewing the Publishing Process

Distributor Agents pane

Reviewing the Distributor Agents

Subscription pane

Reviewing the Subscription Process

Data flow indicators

Reviewing Data Flow Indicators

The following provides a description of panes of icons and gauges in the main activity areas:

Reviewing the Publishing Process

The Publishing pane provides data regarding the following components of the publishing process:

Clicking this row displays a pop-up containing a table of all publication databases. This table is identical to the one shown when clicking the Publishing server row, except for the filtering by server, which is carried out by clicking the Server column.
IMPORTANT: Clicking each publication database’s row opens the Replication Publications drilldown, which only displays publications stored on the selected publication database. To view the entire list of publications from all publication databases, click the Publications toolbar button.
Clicking this row opens the Replication Publications drilldown, which allows reviewing publications by their type. For details, see Monitoring the Replication Publications .
Related Documents

The document was helpful.

Select Rating

I easily found the information I needed.

Select Rating