Chat now with support
Chat with Support

Foglight for SQL Server (Cartridge) 5.9.4.20 - User Guide

Introduction to this Guide Using Foglight for SQL Server
Viewing the Databases Dashboard Overview Dashboard Advisories Dashboard Monitoring Data Replication Monitoring SQL Performance Reviewing Memory Usage Reviewing the Instance Activity Reviewing Database Usage Reviewing the Services Using the HADR Drilldown Using the Logs Drilldown Reviewing Configuration Settings Viewing User-defined Performance Counters and Collections
Monitoring Business Intelligence Services Administering Foglight for SQL Server
Configuration Settings Managing Foglight for SQL Server Agent Settings Reviewing Foglight for SQL Server Alarms Generating Reports Monitoring SQL Server instances on VMware servers
Glossary
A
Access methods Adhoc SQL Plans Alarm Alert Allow updates Anonymous subscription Authentication AutoClose AutoGrow Automatic Discovery AutoShrink B Batch BCP (Bulk Copy Program) Blocking Books Online Bound trees Buffer Buffer cache Buffer pool Bulk copy Bulkinsert Bulk load C Cache CAL Calibration Cardinality Cartridge Chart Checkpoint process Client network utility CLR Compile Connect Connection Connectivity software CPU Usage Cursors D Data access components Data file Data storage engine Database Database object DataFlow DBCC DBID DBO Deadlock Disk queue length Disk transfer time Disk utilization DiskPerf Distributing instance Distributor DMO Drilldown DTC DTS E Error log Event alert Execution contexts Extended stored procedures Extent External procedures F File Filegroup File cache Foglight Agent Manager Foglight Management Server Foreign key Forwarded records Free buffers Free list Free pages Free potential Free space Freespace scans Full text search G GAM Ghosted records Growth increment GUID H Hash buckets Hashing Heap Hit rate Hit ratio Host name Host process I I/O Index Indid Integrated security Intent Locks J Job K Kernel memory Kernel mode Kill L Latch Lazy writer Licensing Lightweight pooling Lock Lock area Lock escalation Lock mode Log Log cache Log writer Logical I/O LRU LSN M Master MaxSize MDAC Metric Misc.normalized trees Model Monitor page file N Named pipes Net library NIC Null O OBID Object plans OLAP OLAP service OLTP Optimizer Optimizer cache osql P Page life expectancy Paging Panel Parse Parser Per seat licensing Per server licensing Performance alert Physical I/O Physical read Physical write PID Pinned Plan Plan cache Potential growth Prepared SQL plans Primary key Privileged mode Procedure cache Procedure plans Process Profiler Publication database Publisher Publisher databases Publishing server Pull subscription Pulse Push subscription Q Query plan R RAID Random I/O Read ahead Recompile Referential integrity Relational data engine Replication procedure plans Role Rollback S sa Schema locks Sequential I/O Session Severity SGAM Shared locks Show advanced options SMP Sort, Hash, Index Area SPID Spike Spinner SQL Agent Mail SQL Mail SQL Plans SQL Server Agent SQL Server authentication SQL Server books online Standard deviation Stolen pages Stored procedure Support service SYSADMIN role T TDS TempDB Temporary tables and table variables Threshold Torn page detection Transaction Trigger Trigger plans Truncate Trusted U UMS Unused space User connection area User mode V Virtual log file VLF W Waitfor Windows authentication mode Working set
Reference
SQL PI Repository Cold Backup Procedure SQL Performance Investigator Metrics
Active Time All SQL Agents CPU Usage All SQL Agents Resident Memory Usage Availability Average Physical I/O Operations Average SQL Response Time Backup Recovery Wait Blocked Lock Requests Checkpoint Pages CLR Wait CPU Usage CPU Wait Cursor Synchronization Wait Database Replication Wait Deferred Task Worker Wait Degree of Parallelism Disk Utilization DTC CPU Usage DTC Resident Memory Usage Distributed Transaction Wait Executions Ended Executions Started External Procedures Wait Full Scans Full Text Search CPU Usage Full Text Search Resident Memory Usage Full Text Search Wait Free Buffer Wait Hosted Components Wait IO Bulk Load Wait IO Completion Wait IO Data Page Wait IO Wait Latch Buffer Wait Latch Wait Latch Savepoint Wait Lazy Writes Lock Wait Lock Bulk Update Wait Lock Exclusive Wait Lock Intent Wait Lock Requests Lock Schema Wait Lock Shared Wait Lock Update Wait Lock Wait Log Buffer Wait Log Flushes Log Other Wait Log Synchronization Wait Log Wait Log Write Wait Memory Wait Network IO Wait Network IPC Wait Network Mirror Wait Network Wait Non SQL Server CPU Usage Non SQL Resident Memory Usage OLAP CPU Usage OLAP Resident Memory Usage OLEDB Provider Full Text Wait Other CPU Usage Other Miscellaneous Wait Other Wait Overall CPU Page Life Expectancy Page Splits Parallel Coordination Wait Physical I/O Physical Memory Used Physical Page Reads Physical Page Writes Probe Scans Plan Cache Hit Rate Range Scans Rec Ended Duration Remote Provider Wait Run Queue Length Samples Service Broker Wait Session Logons Session Logoffs SQL Agent CPU Usage SQL Agent Resident Memory Usage SQL Executions SQL Mail CPU Usage SQL Mail Resident Memory Usage SQL Recompilations SQL Response Time SQL Server Background CPU Usage SQL Server Cache Memory SQL Server Connections Memory SQL Server Connections Summary SQL Server Foreground CPU Usage SQL Server Resident Memory Usage SQL Server Swap Memory Usage Synchronous Task Wait Table Lock Escalation Target Instance Memory Total CPU Usage Total Instance Memory Virtual Memory Used
Rules Collections and Metrics
SQL Server Agent's Default Collections Access Methods Agent Alert List Agent Job List Always On Availability Groups Backup Locations Blocking History Blocking List Buffer Cache List Buffer Manager CLR Assemblies Cluster Summary Configuration Database Index Density Vectors Database Index Details Database Index Fragmentation Info Database Index Histogram Database Index List Database Information Database Properties Database Sessions (Session List) Database Summary Database Tables List Databases Deadlock DTC Information Error Log Error Log List Error Log Scan File Groups File Data Flow Statistics File Groups Files Files Drive Total Files Instance Summary Full Text Catalog InMemory OLTP (XTP) Instance Wait Categories Instance Wait Events Job Messages Latches and Locks Lock Statistics Locks List Log Shipping Log Shipping Error Logical Disks Memory Manager Mirroring Mirroring Performance Counters Missing Indexes Plan Cache Distribution Plan Cache List Replication Agents Replication Agent Session Actions Replication Agent Session Merge Articles Replication Agent Sessions Replication Agent Sessions by Type Replication Available Replication Publications Replication Subscriptions Reporting Services Resource Pool Session Data Session Trace SQL PI Instance Statistics SQL Server Connections Summary SQL Server Global Variables SQL Server Host SQL Server Load SQL Server Services SQL Server Throughput SQL Server Version Info SSIS OS Statistics SSIS Summary Statistics Top SQLs Top SQL Batch Text Top SQL Long Text Top SQL Plan Top SQL Short Text Top SQL Summary Traced SQL PA Usability User-defined Performance Counters User-defined Queries Virtualization XTP Session Transactions Statistics

Overview Dashboard

Identifying the Instance

The Instance identification indicators allow you to identify the currently monitored instance, its type and its operation period.

These indicators are as follows:

Up Sinceidentifies the date and time when the instance was last started.

Tracking the Instance Data Flow

The following components represent the data flow in the SQL Server operation, from the session to the physical disk storage:

Monitoring General Session Statistics

The Sessions pane monitors all session types, that is, system, user and SQL Server Agent sessions. Using this pane allows viewing the response time compared with the number of sessions and the instance’s level of activity. A high response time value may result from a long queue, that is, an overly high percentage of active users.

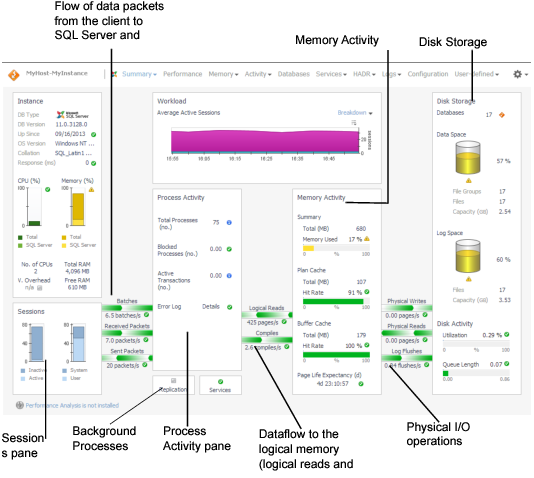
Long queues can indicate one of the following issues:

The Sessions pane displays the total number of sessions, distributed according to the following distinctions:

The parameters in this pane lead to the SQL Activity > Sessions panel. For details, see Reviewing the SQL Server Instance Activity and Reviewing Session Details , respectively, in Reviewing the Instance Activity .

The client applications represented graphically in the Sessions pane communicate with the SQL Server by sending and receiving network packets and by submitting SQL statements for execution by SQL Server. The flows, detailed in the following table, help indicate performance issues if their values are too low.

The rate at which batches of SQL statements are being submitted to SQL Server for execution.

The rate at which the SQL Server receives network packets from client applications.

When this icon is yellow, clicking it displays text that describes theBlocking Alarm deviations that triggered this display, along with a representation of the rate at which SQL Server is encountering network packet errors.

The rate at which network packets are being sent from SQL Server to client applications.

When this icon’s color is yellow, clicking it displays text that describes the deviations that triggered this display, along with a graphic representation of the rate at which SQL Server is encountering network packet errors.

The Process Activity pane allows monitoring the processes, both system and user sessions, run by the SQL Server. This pane also features other performance indicators, such as total number of lock requests per second and CPU usage, and allows accessing the error log.

Table 16. The Process Activity pane displays the following parameters:

The total number of SQL Server processes, including both user and system processes.

Number of processes that are waiting for another process to release a resource that the process is currently locking. Blocked processes can sometimes lead to bottlenecks.

The Blocked Process indicator changes its color when one or more processes become blocked.

For details, see Blocking Alarm and Deadlocks Alarm .

The average number of active transactions for each database of the monitored instance.

The SQL Server and SQL Agent error logs.

When scanning is enabled, Foglight for SQL Server scans the SQL Server logs and raises alarms upon finding error messages that contain any of the error log alert rules. These rules can be specified for all connections, or for the current connection, using the Log Scanning view in the Databases Administration dashboard. For details, see Defining Error Log Filtering .

Hovering over this icon displays the number of errors that were recorded in the SQL Server error log during the selected time range (by default, last 60 minutes).

For details about the error log alarms, see Error Log Alarm .

For further details, see Reviewing the SQL Server Instance Activity .

To communicate with the SQL memory, the SQL processes use logical reads and compiles, graphically represented as flows in the homepage.

Related Documents

The document was helpful.

Select Rating

I easily found the information I needed.

Select Rating