Chat now with support
Chat with Support

Foglight for PeopleSoft 5.6.11 - User and Reference Guide

Using Foglight for PeopleSoft
Exploring the PeopleSoft Dashboards Foglight for PeopleSoft Agents PS_AppMonitor Agent PS_AppServer Agent PS_DB2SQL Agent PS_MSSQL Agent PS_OracleSQL Agent PS_PPM Agent PS_SchedMonitor Agent PS_SchedServer Agent PS_Scheduler Agent Manual Agent Naming Deployment Scenario Procedures
Foglight for PeopleSoft Reference
Views
PS_AppServer Views PS_DB2SQL Views PS_MSSQL Views PS_OracleSQL Views PS_PPM Views PS_SchedServer Views PS_Scheduler Views
Data

PSS_DB_Overview Graph View

CPU (%) The percentage of CPU resources the Report Distribution process is using at the time of collection.
MEM (%) The percentage of physical memory the Report Distribution process is using at the time of collection.
Drill down on any bar. For more information, see PSS_Queue_Overview Graph View. This displays the resource consumption of the queue(s) associated with that database.

PSS_Jobs_ProcessingTime Table View

Database Name The PS database name.
Operator ID The name of the PeopleSoft application user who scheduled the job or process.
Job Name The name of the job.
Job Number The number of the job. This is the Job Instance Number if the JobNumber is not zero. If the JobNumber is zero or the process submitted through the process scheduler has no job associated with it, then this number is the Process Instance Number.
Class The job class, for example, SQR, PSJob, Crystal, and so on.
Queue Name The name of PS Scheduler job queue.
Processing Time The amount of time, in seconds, the job takes to process completely. If the job completes successfully during the collection period, the Processing Time is the difference between the end time and the begin time for the job. If the job is in the processing state at the time of collection, the Processing Time is the difference between the system time at the time of collection and the begin time for the job. For jobs that end with other statuses, such as Unsuccessful, the Processing Time is the time from the Begin Time to the time the job ended with that status.
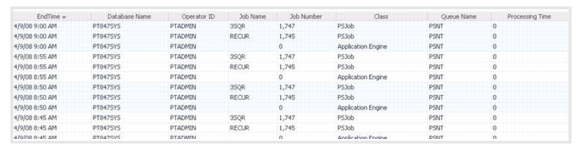
Go to PSS_Processes_ProcessingTime Table View . This displays the processing times for the process scheduler processes.

PSS_JobSummary Graph View

Queued The number of “Queued” (RunStatus == 5) jobs.
Error The number of “Error” (RunStatus == 3) jobs.
Hold The number of “Hold” (RunStatus == 4) jobs.
Initiated The number of “Initiated” (RunStatus == 6) jobs.
Processing The number of “Processing” (RunStatus == 7) jobs.
Total The total number of DISTSTATUS processes.
Unsuccessful The number of “Unsuccessful” (RunStatus == 10) jobs.
Drill down on any bar. For more information, see PSS_ProcessSummary Graph View. This displays the process scheduler process summary.

PSS_Prcs_Types Graph View

PrcsType The process type, for example: SQR, Query, Cobol, AE, and so on.
Count The number for a specific job.
Related Documents

The document was helpful.

Select Rating

I easily found the information I needed.

Select Rating