Chat now with support
Chat with Support

Foglight for PeopleSoft 5.6.11 - User and Reference Guide

Using Foglight for PeopleSoft
Exploring the PeopleSoft Dashboards Foglight for PeopleSoft Agents PS_AppMonitor Agent PS_AppServer Agent PS_DB2SQL Agent PS_MSSQL Agent PS_OracleSQL Agent PS_PPM Agent PS_SchedMonitor Agent PS_SchedServer Agent PS_Scheduler Agent Manual Agent Naming Deployment Scenario Procedures
Foglight for PeopleSoft Reference
Views
PS_AppServer Views PS_DB2SQL Views PS_MSSQL Views PS_OracleSQL Views PS_PPM Views PS_SchedServer Views PS_Scheduler Views
Data

PS_PPM Views

PPM_App_Server_Overview Graph View

Avg Duration Time(s) Average execution time for PMU 400s aggregated to the PeopleSoft application server level during the collection interval. Avg Duration Time is calculated as follows:
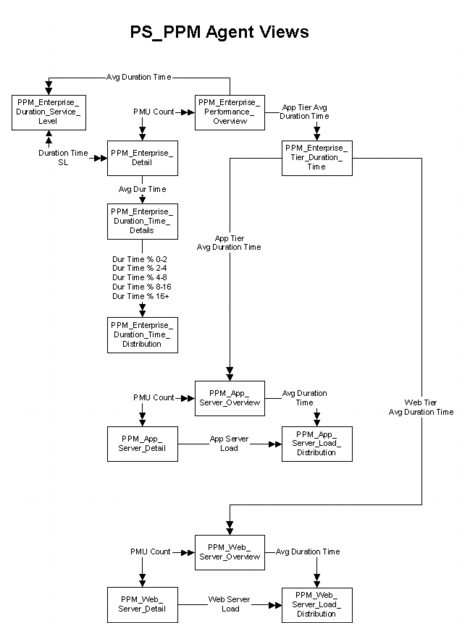
Drill down on Avg Duration Time(s) line. For more information, see PPM_App_Server_Load_Distribution Graph View. This displays the processing load of the PeopleSoft application servers.

PPM_Enterprise_Performance_Overview Graph View

PeopleSoft Enterprise Name Name of the PeopleSoft enterprise.
PMU Count Number of 100 and 101 PMUs executed during the collection interval.
User Count Number of unique users executing a completed 100 or 101 PMU at the PeopleSoft enterprise level during the collection period.
Avg Duration Time(s) Average execution time for completed 100 and 101 PMUs at the PeopleSoft enterprise level during the collection period.
Web Tier Avg Duration Time(s) Average execution time for completed PMUs aggregated at the Web server tier level during the collection interval. Web Tier Avg Duration Time is calculated as follows:
App Tier Avg Duration Time(s) Average execution time for all completed PMUs aggregated at the application server tier level during the collection interval. The App Tier Avg Duration Time is calculated as follows:
Avg Duration Time(s) line. For more information, see PPM_Enterprise_Duration_Service_Level Graph View. This displays the percentage of PeopleSoft enterprise service level success.
PMU Count line. For more information, see PPM_Enterprise_Details Table View. This displays detailed PeopleSoft enterprise statistics.
 App Tier or Web Tier Avg Duration Time(s) line. For more information, see PPM_Enterprise_Tier_Duration_Time Graph View. This displays a history of duration time distribution.

PPM_Web_Server_Overview Graph View

Avg Duration Time(s) Average execution time for all completed 100 and 101 PMUs at the PeopleSoft enterprise level during the collection period.
Drill down on Avg Duration Time(s) line. For more information, see PPM_Web_Server_Load_Distribution Graph View. This displays the processing load of PeopleSoft Web servers.
Related Documents

The document was helpful.

Select Rating

I easily found the information I needed.

Select Rating