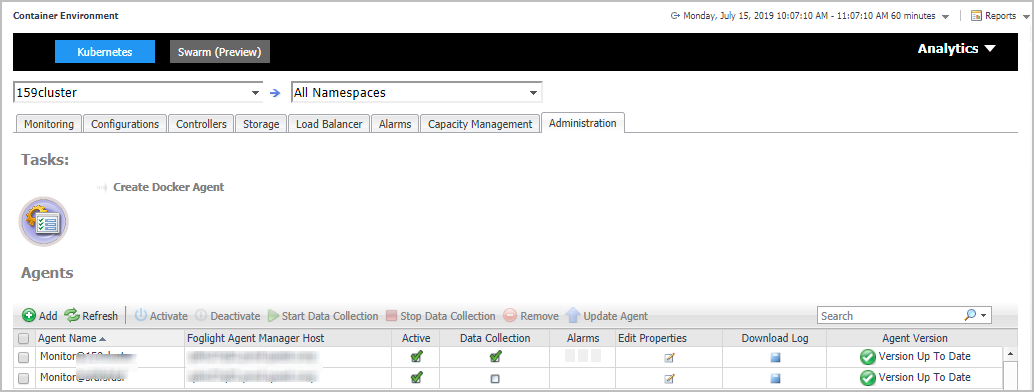
The Administration dashboard supports new agent creation and existing agents management. Use Create Docker Agent or Add to create a new agent. See Creating and Activating a Kubernetes Agent for more information. Use Activate, Deactivate, Start Data Collection, Stop Data Collection, Remove, and Update Agent to manage the agent. Click Edit Properties to update the properties of the chosen agent.
|
NOTE: The Administration dashboard can be accessed only when the users have both the Administrator role and the Container Administrator role. To grant the users with the Container Administrator role, go to Administration > Users & Security management under Administer Server > Manage Users, Groups, Roles > Roles tab. |
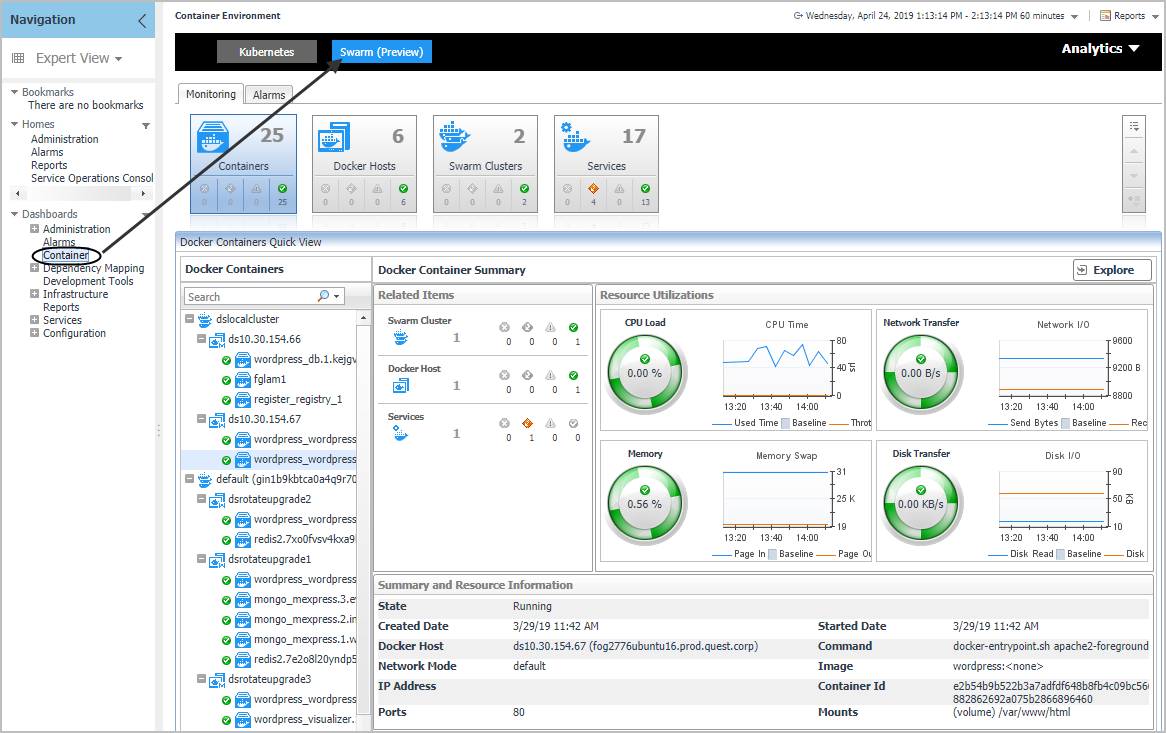
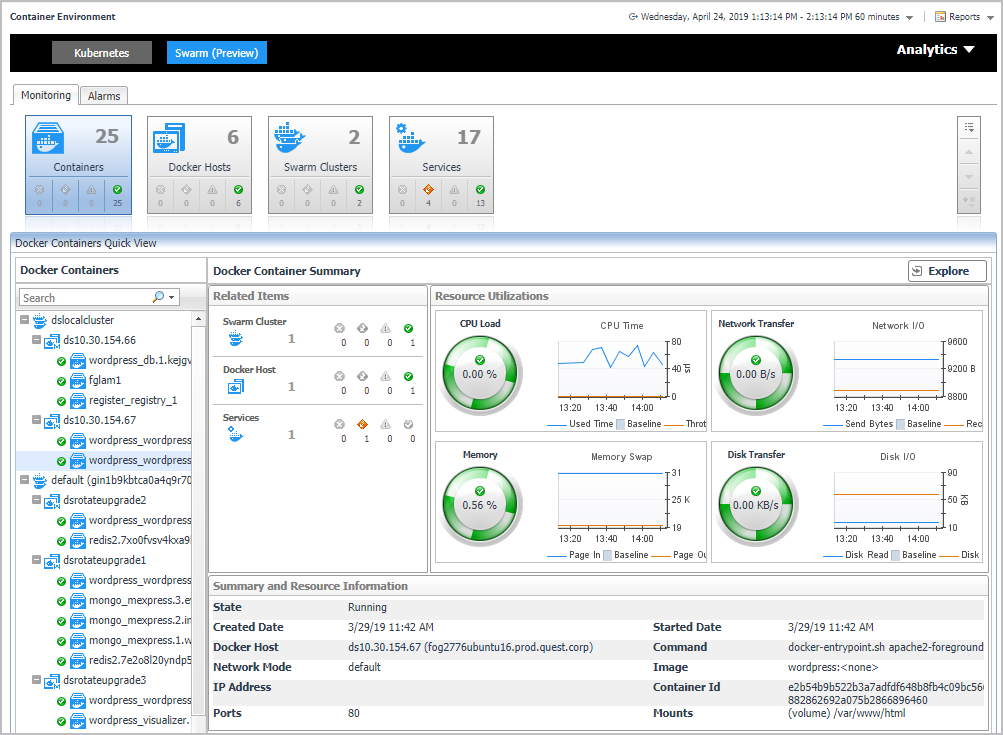
The Docker Container Quick View appears after clicking Monitoring > Containers. Click Swarm (Preview) from the header on top to switch to Docker Swarm dashboard.
This view consists of the following two panes:
|
• |
The Docker Containers tree view, which appears on the left of Docker Containers Quick View, lists the containers existing in the monitored Docker environment. The containers in the tree view are grouped by cluster > docker host > container. |
|
• |
The Docker Container Summary view, which appears on the right after you select an individual container in the Docker Containers tree view. |
The Docker Container Summary view appears on the right when you select a container in the Docker Containers tree view.
The Docker Container Summary view displays the following data:
|
• |
|
• |
Resource Utilizations: The resource utilization for the selected Docker Container over a selected period of time, which includes the following: |
|
• |
CPU Load: Shows the CPU utilization of the selected container. |
|
• |
Network Transfer: Shows the transfer bytes rate of the selected container over a selected period of time. |
|
• |
Memory: Shows the memory utilization of the selected container. |
|
• |
Disk Transfer: Shows the disk transfer bytes rate of the selected container over a selected period of time. |
|
• |
Summary and Resource Information: Displays the detailed information about the selected Container, including State, Command, Created Time, Started Time, Image, and so on. |
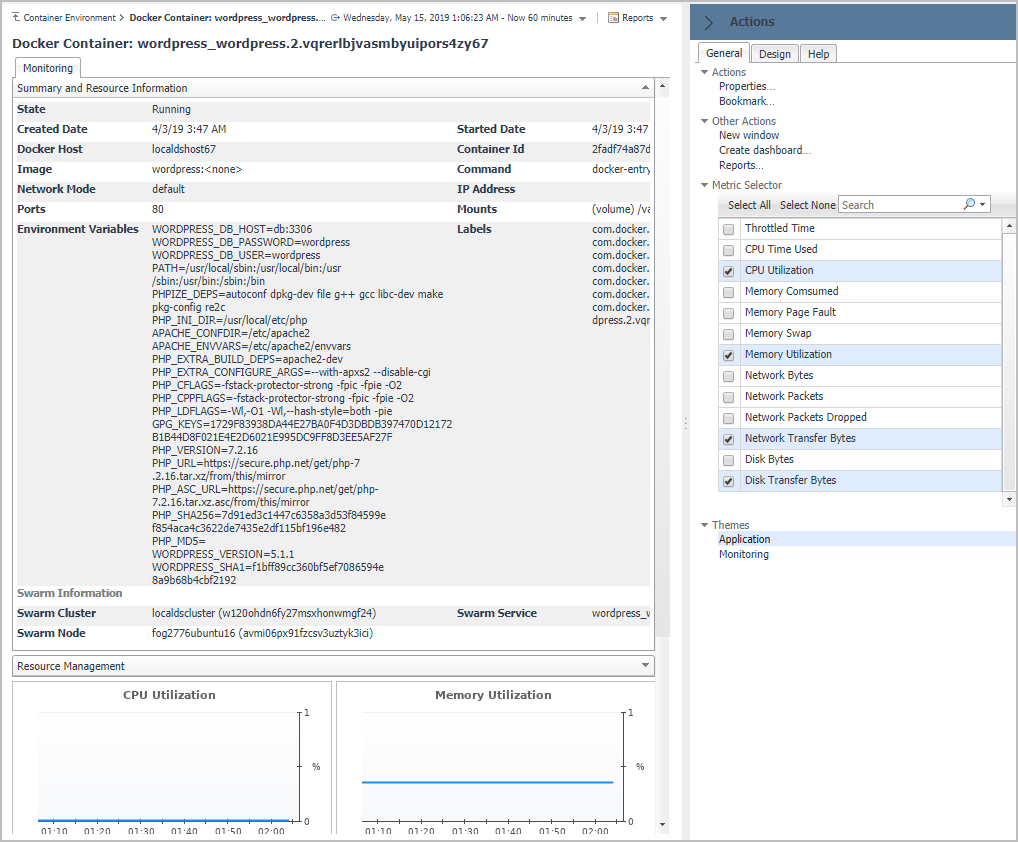
Click Explore on the upper right of the Docker Container Summary view to open the Container Explorer view, which shows more detailed information about this container.
The Container Explorer view opens when you click Explore in the Docker Container Summary view, which includes the following tabs: