|
1 |
|
• |
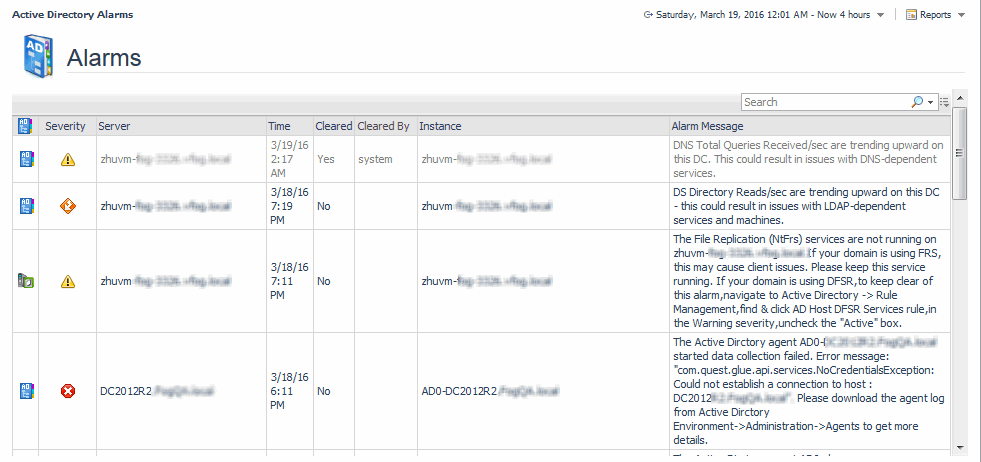
Click Active Directory Alarms to display a list of the current alarms triggered within Foglight for Active Directory. |
|
• |
Click Active Directory Environment to display the Active Directory Environment dashboard, which includes the following tabs: |
|
• |
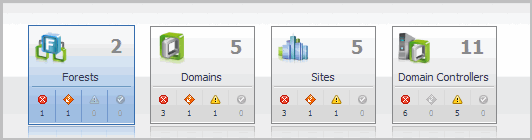
Monitoring: displays a summary of the Active Directory® objects being monitored and their current state. |
|
• |
CA Health Check: displays a summary of the Certificate Authority servers being monitored. |
|
• |
Administration: allows you to perform administrative tasks, including: |
|
• |
Reports: allows you to build, view, and manage custom reports. |
|
• |
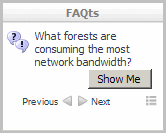
FAQTs: displays questions relating to a selected object. |
|
• |
Click Active Directory Explorer to display performance metrics and alarms for an Active Directory object type container or individual object. |
|
• |
Click Rule Management to view and manage Foglight for Active Directory rules. |
The Active Directory Environment dashboard includes the following tabs:
|
• |
Monitoring: displays a summary of the Active Directory® objects being monitored and their current state. For details, see Active Directory Environment > Monitoring tab. |
|
• |
CA Health Check: displays a summary of the Certificate Authority objects being monitored. |
|
• |
Administration: allows you to perform administrative tasks, including: |
|
• |
Reports: allows you to manage custom Active Directory reports. For details, see Active Directory Environment > Reports tab. |
|
• |
FAQts: displays questions relating to a selected object. For details, see Active Directory Environment > FAQts tab. |
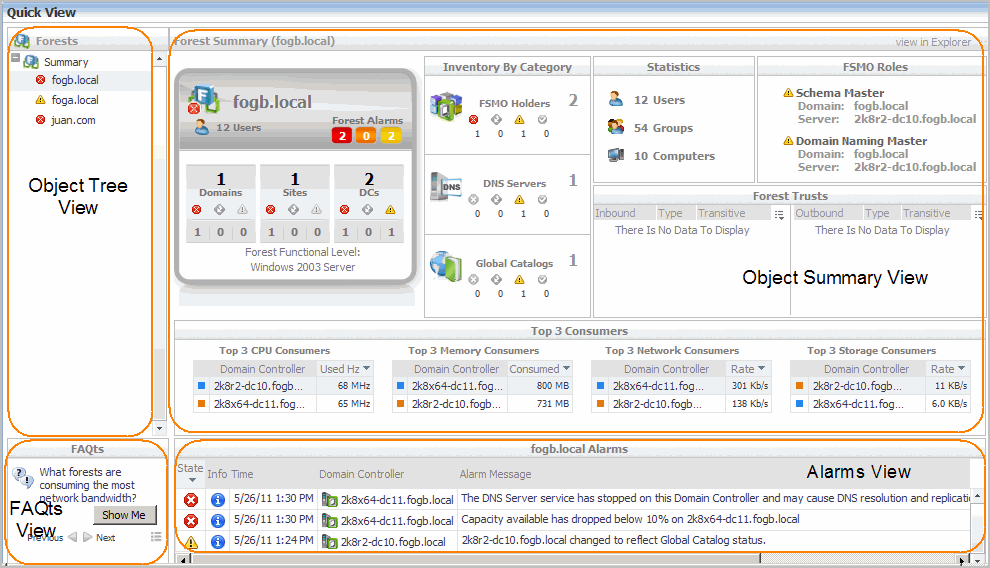
The Quick View is located across the middle of the Active Directory Environment dashboard.
The Quick View consists of the following embedded views:
The following table lists the information displayed when the different object tiles are selected.
Use the Previous and Next buttons to scroll through the questions available for the selected object. Use the Show Me button to display the answer to the displayed question. Select the button to display a list of all relevant questions from which to select.