Active Directory Explorer dashboard
The Active Directory Explorer dashboard has a hierarchal interface that you can use to view various performance metrics and alarms within your Active Directory® infrastructure. It provides informative views through which you can quickly and easily access detailed information about any of the objects in your Active Directory environment.

The Active Directory Explorer dashboard contains the following views:
Active Directory Enterprise view
After choosing an object from the Domain Controllers Inventory tile, the Active Directory Enterprise view appears in the navigation panel, under the Dashboards list.
The Active Directory Enterprise view provides an organized view of the Active Directory® objects that are monitored by the Foglight for Active Directory.
Clicking an object type container or object in the Active Directory Enterprise view refreshes all of the views in the Active Directory Explorer Primary view to display information pertaining to the selected object.
The Active Directory Enterprise view is made up of the following embedded views:
Use these views to display performance metrics and alarms for an individual Active Directory® object or group of objects of a particular type.
The Topology view is organized into a tree using object type containers for branches. The top-level containers are the main Active Directory object types (that is, forests, domains, sites, and domain controllers) and each object type container contains every object of that particular type that is managed by the cartridge. Click the expansion state box to the left of a container to expand the view to display the individual objects.
To the left of each object, a status indicator represents the alarm of highest severity that is outstanding for that object.
The Hierarchy view represents the logical layout of the containers in your Active Directory environment. In the Hierarchy view, each forest container is organized into a tree illustrating where each domain and domain controller resides within your Active Directory environment. Click on the expansion state box to the left of a container to expand the view to display subordinate objects.
To the left of each object, a status indicator represents the alarm of highest severity that is outstanding for that object.
When you hover the cursor over an object in the Active Directory Enterprise view, a popup appears that provides a summary of the present state of the selected object. For example, the following popup appears when you hover the cursor over an individual DC object in the Active Directory Enterprise view.
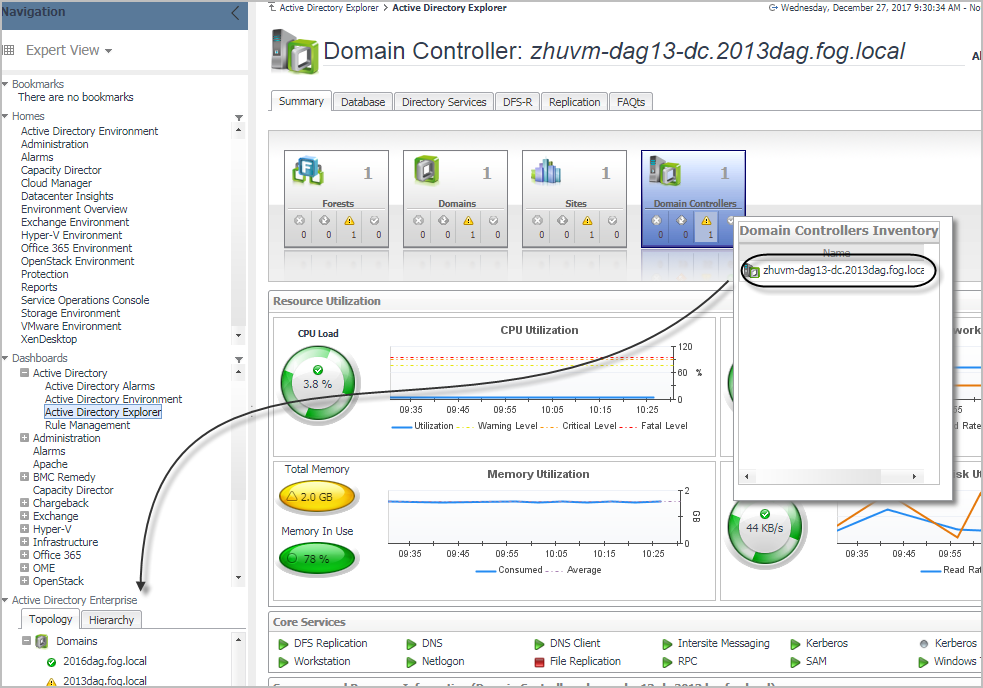
Active Directory Explorer Primary view
The Active Directory Explorer has a Primary view which takes up the entire display panel of the browser interface. This view displays information based on the object type container or object selected in the Active Directory Enterprise view.
The Active Directory Explorer Primary view displays performance metrics and alarms related to the objects within an object type container or an individual Active Directory® object.
The heading area located across the top of the Active Directory Explorer Primary view consists of the following main components:
The object icon and name to the left of the heading specify the object type container or individual object that is selected in the Active Directory Enterprise view.
The alarm summary at the right of the heading shows you the number of alarms at each severity level that are outstanding for the selected object. Clicking an alarm count displays a popup that lists the active alarms for the object. From this popup you can display additional details about an individual alarm.
The navigation tabs are located immediately below the selected object’s name. These navigation tabs vary from object to object, but generally contain an object summary tab, a FAQts tab, and one or more tabs of other relevant information. The following table lists the navigation tabs displayed based on the item selected in the Active Directory Enterprise view.
The Primary view changes in appearance and content, depending on which navigation tab is selected. The metrics and amount of detail displayed varies depending on the type of object you selected in the Active Directory Enterprise view.
The Primary view may contain the following embedded views:
Selecting the Summary navigation tab displays the Summary view just below the heading. This view provides a hierarchical inventory, in the form of tiles, of the objects that are related to the object or object container selected in the Active Directory Enterprise view. Each tile shows how many objects of the corresponding object type there are, as well as the count of objects of that type in each of the alarm states (fatal, critical, warning, and normal).
On a tile, click the object type icon, the object type name, or the object count, to view an inventory popup that lists all objects of the corresponding type, along with their respective states. Click an object in the inventory popup to view details for that object in the Active Directory Explorer Primary Summary view.
On a tile, click an alarm state or the number below it to view an alarms popup that shows the outstanding alarms of that state for the corresponding object type. Click an alarm in the alarms popup to view details about the selected alarm.
More detailed information associated with the object or object container selected in the Active Directory Enterprise view is displayed in views below the Summary view. The following table lists the embedded views displayed when the different objects or object containers are selected.
When an individual domain controller is selected in the Active Directory Enterprise view, a Database navigation tab appears. Selecting the Database navigation tab displays the Domain Controller Database view. By default, this view consists of database performance metrics associated with the selected DC. Additional database metrics can optionally be displayed by enabling the corresponding collection group on the Active Directory Metrics Management dashboard.
When an individual domain controller is selected in the Active Directory Enterprise view, a Directory Services navigation tab appears. Selecting the Directory Services navigation tab displays the Domain Controller Directory Services view. By default, this view consists of directory service related performance metrics associated with the selected DC. Additional directory services metrics can optionally be displayed by enabling the corresponding collection group on the Active Directory Metrics Management dashboard.
When an individual domain controller is selected in the Active Directory Enterprise view, either an FRS or a DFS-R navigation tab will be present, depending on the file replication service set up for the SYSVOL on the selected DC.
|
• |
Selecting the FRS navigation tab displays the Domain Controller FRS view. By default, this view consists of File Service Replication (FRS) related performance metrics associated with the SYSVOL on the selected DC. Additional file service replication metrics can optionally be displayed by enabling the corresponding collection group on the Active Directory Metrics Management dashboard. |
|
• |
Selecting the DFS-R navigation tab displays the Domain Controller DFS-R view. By default, this view consists of Distributed File System Replication (DFS-R) service performance metrics associated with the SYSVOL on the selected DC. Additional DFS replication service metrics can optionally be displayed by enabling the corresponding collection group on the Active Directory Metrics Management dashboard. |
When an individual domain controller is selected in the Active Directory Enterprise view, a Replication navigation tab appears. Selecting the Replication navigation tab displays the Domain Controller Replication view. By default, this view consists of replication performance metrics associated with the selected DC. Additional replication metrics can optionally be displayed by enabling the corresponding collection group on the Active Directory Metrics Management dashboard.
Selecting the FAQts navigation tab displays a list of all the questions available for all Active Directory® objects.
Active Directory Rule Management dashboard
The Active Directory Rule Management dashboard contains a sortable list of the conditional severity rules used by the Foglight for Active Directory. From this dashboard you can quickly see which conditional rules are enabled/disabled, the states (fatal, critical or warning) with active conditions, predefined alarm threshold values, rules with current alarms, and a brief description of each rule.

For a description of the Active Directory Rule Management dashboard and for more information on the Foglight for Active Directory rules and how to enable, disable or modify them, see Foglight for Active Directory rules.
