Chat now with support
Chat with Support

Foglight for SQL Server (Cartridge) 6.1.0.10 - User Guide

Introduction to this Guide Using Foglight for SQL Server
Viewing the Databases Dashboard Overview Dashboard Advisories Dashboard Monitoring Data Replication Monitoring SQL Performance Reviewing Memory Usage Reviewing the Instance Activity Reviewing Database Usage Reviewing the Services Using the HADR Drilldown Using the Logs Drilldown Reviewing Configuration Settings Viewing User-defined Performance Counters and Collections
Monitoring Business Intelligence Services Administering Foglight for SQL Server
Configuration Settings Managing Foglight for SQL Server Agent Settings Reviewing Foglight for SQL Server Alarms Generating Reports Monitoring SQL Server instances on VMware servers
Glossary
A
Access methods Adhoc SQL Plans Alarm Alert Allow updates Anonymous subscription Authentication AutoClose AutoGrow Automatic Discovery AutoShrink B Batch BCP (Bulk Copy Program) Blocking Books Online Bound trees Buffer Buffer cache Buffer pool Bulk copy Bulkinsert Bulk load C Cache CAL Calibration Cardinality Cartridge Chart Checkpoint process Client network utility CLR Compile Connect Connection Connectivity software CPU Usage Cursors D Data access components Data file Data storage engine Database Database object DataFlow DBCC DBID DBO Deadlock Disk queue length Disk transfer time Disk utilization DiskPerf Distributing instance Distributor DMO Drilldown DTC DTS E Error log Event alert Execution contexts Extended stored procedures Extent External procedures F File Filegroup File cache Foglight Agent Manager Foglight Management Server Foreign key Forwarded records Free buffers Free list Free pages Free potential Free space Freespace scans Full text search G GAM Ghosted records Growth increment GUID H Hash buckets Hashing Heap Hit rate Hit ratio Host name Host process I I/O Index Indid Integrated security Intent Locks J Job K Kernel memory Kernel mode Kill L Latch Lazy writer Licensing Lightweight pooling Lock Lock area Lock escalation Lock mode Log Log cache Log writer Logical I/O LRU LSN M Master MaxSize MDAC Metric Misc.normalized trees Model Monitor page file N Named pipes Net library NIC Null O OBID Object plans OLAP OLAP service OLTP Optimizer Optimizer cache osql P Page life expectancy Paging Panel Parse Parser Per seat licensing Per server licensing Performance alert Physical I/O Physical read Physical write PID Pinned Plan Plan cache Potential growth Prepared SQL plans Primary key Privileged mode Procedure cache Procedure plans Process Profiler Publication database Publisher Publisher databases Publishing server Pull subscription Pulse Push subscription Q Query plan R RAID Random I/O Read ahead Recompile Referential integrity Relational data engine Replication procedure plans Role Rollback S sa Schema locks Sequential I/O Session Severity SGAM Shared locks Show advanced options SMP Sort, Hash, Index Area SPID Spike Spinner SQL Agent Mail SQL Mail SQL Plans SQL Server Agent SQL Server authentication SQL Server books online Standard deviation Stolen pages Stored procedure Support service SYSADMIN role T TDS TempDB Temporary tables and table variables Threshold Torn page detection Transaction Trigger Trigger plans Truncate Trusted U UMS Unused space User connection area User mode V Virtual log file VLF W Waitfor Windows authentication mode Working set
Reference
SQL Performance Investigator Metrics
Active Time All SQL Agents CPU Usage All SQL Agents Resident Memory Usage Availability Average Physical I/O Operations Average SQL Response Time Backup Recovery Wait Blocked Lock Requests Checkpoint Pages CLR Wait CPU Usage CPU Wait Cursor Synchronization Wait Database Replication Wait Deferred Task Worker Wait Degree of Parallelism Disk Utilization DTC CPU Usage DTC Resident Memory Usage Distributed Transaction Wait Executions Ended Executions Started External Procedures Wait Full Scans Full Text Search CPU Usage Full Text Search Resident Memory Usage Full Text Search Wait Free Buffer Wait Hosted Components Wait IO Bulk Load Wait IO Completion Wait IO Data Page Wait IO Wait Latch Buffer Wait Latch Wait Latch Savepoint Wait Lazy Writes Lock Wait Lock Bulk Update Wait Lock Exclusive Wait Lock Intent Wait Lock Requests Lock Schema Wait Lock Shared Wait Lock Update Wait Lock Wait Log Buffer Wait Log Flushes Log Other Wait Log Synchronization Wait Log Wait Log Write Wait Memory Wait Network IO Wait Network IPC Wait Network Mirror Wait Network Wait Non SQL Server CPU Usage Non SQL Resident Memory Usage OLAP CPU Usage OLAP Resident Memory Usage OLEDB Provider Full Text Wait Other CPU Usage Other Miscellaneous Wait Other Wait Overall CPU Page Life Expectancy Page Splits Parallel Coordination Wait Physical I/O Physical Memory Used Physical Page Reads Physical Page Writes Probe Scans Plan Cache Hit Rate Range Scans Rec Ended Duration Remote Provider Wait Run Queue Length Samples Service Broker Wait Session Logons Session Logoffs SQL Agent CPU Usage SQL Agent Resident Memory Usage SQL Executions SQL Mail CPU Usage SQL Mail Resident Memory Usage SQL Recompilations SQL Response Time SQL Server Background CPU Usage SQL Server Cache Memory SQL Server Connections Memory SQL Server Connections Summary SQL Server Foreground CPU Usage SQL Server Resident Memory Usage SQL Server Swap Memory Usage Synchronous Task Wait Table Lock Escalation Target Instance Memory Total CPU Usage Total Instance Memory Virtual Memory Used
Rules Collections and Metrics
SQL Server Agent's Default Collections Access Methods Agent Alert List Agent Job List Always On Availability Groups Backup Locations Blocking History Blocking List Buffer Cache List Buffer Manager CLR Assemblies Cluster Summary Configuration Database Index Density Vectors Database Index Details Database Index Fragmentation Info Database Index Histogram Database Index List Database Information Database Properties Database Sessions (Session List) Database Summary Database Tables List Databases Deadlock DTC Information Error Log Error Log List Error Log Scan File Groups File Data Flow Statistics File Groups Files Files Drive Total Files Instance Summary Full Text Catalog InMemory OLTP (XTP) Instance Wait Categories Instance Wait Events Job Messages Latches and Locks Lock Statistics Locks List Log Shipping Log Shipping Error Logical Disks Long Running Session Memory Manager Mirroring Mirroring Performance Counters Missing Indexes Plan Cache Distribution Plan Cache List Replication Agents Replication Agent Session Actions Replication Agent Session Merge Articles Replication Agent Sessions Replication Agent Sessions by Type Replication Available Replication Publications Replication Subscriptions Reporting Services Resource Pool Session Data Session Trace SQL PI Instance Statistics SQL Server Connections Summary SQL Server Global Variables SQL Server Host SQL Server Load SQL Server Services SQL Server Throughput SQL Server Version Info SSIS OS Statistics SSIS Summary Statistics Top SQLs Top SQL Batch Text Top SQL Long Text Top SQL Plan Top SQL Short Text Top SQL Summary Traced SQL PA Usability User-defined Performance Counters User-defined Queries Virtualization XTP Session Transactions Statistics

Migrating Agents

The SQL Performance Investigator extension is only supported on Windows 64-bit. As a result, you may need to migrate SQL Server agents from an Agent Manager running on Linux to a Windows Agent Manager.

In addition, the migration tool allows you to perform resource balancing between the agent managers running SQL Server agents with and without the SQL PI extension installed.

1
Open the migration wizard by navigating to Dashboards > Databases > Support Dashboard > Databases Technical Support > Database Agents Migration > SQL Server.
6
Click Next to migrate the agents.
7
When migration has completed, click Finish to exit the Wizard.

About Monitoring Extensions

During the installation process you can choose to install and configure one or more of the monitoring extensions. The monitoring extensions provide a more in-depth analysis of the monitored instance and the environment it is running on, creating a whole and unified status.

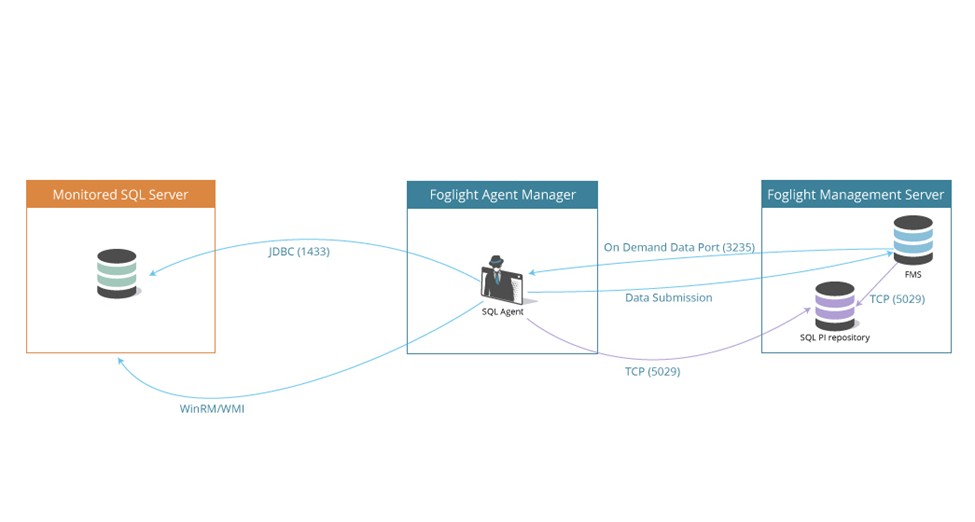
The communication architecture of Foglight for SQL Server is presented below.

SQL Performance Investigator allows you to rapidly identify bottlenecks, anomalies, and application trends by focusing on top resource consumers and providing multi-dimensional SQL domain drilldowns. SQL PI allows you to:

Monitoring the operating system allows you to identify resource consumption and provides a full view of the server health. An Infrastructure agent, which is created automatically as part of the monitoring process, monitors the operating system.

Monitoring the VMware system allows you to identify resource consumption and provides a full view of the data center and ESX health when the server is part of a VMware environment.

Installing and Monitoring a Single SQL Server Instance

Enabling the Foglight Management Server to monitor SQL Server instances requires the creation of the Foglight agents that monitor these instances and ensuring that these agents communicate properly with the Foglight Management Server.

Foglight for SQL Server provides a graphic, intuitive method for creating and configuring multiple agents, which can be used instead of Foglight’s default method for creating agents and editing their properties using the Agent Administration dashboard (see About the Foglight for SQL Server Agent in the Foglight for SQL Server Reference Guide). Foglight for SQL Server allows running a wizard that provides a common entry point for adding and discovering all database instances within a user-specified range, and then configuring these instances for monitoring.

1
2
Click the SQL Server tab in the middle of the Databases View, and then click Monitor.
a
Click the Agent Manager Host link located in the bottom left corner of the dialog box.
Port — Optional. This field can be left empty, unless the TCP/IP connection port is not the default port: 1443.
7
In the Configuration section, select the Alarm Template to use for this instance. The Factory Template will be applied by default. Refer to Viewing, Creating, and Managing Alarm Templates in the Foglight User Guide for more information.
8
Optional To enable SQL Performance Investigator, select SQL PI in the Monitoring Extension section.
The SQL PI Repository dialog is displayed. Select the Agent Manager on which the SQL PI
NOTE: To use gMSA authentication for connections to the PI Repository, select Local User in the Authentication drop-down. This requires that your FMS and Agent Manager are configured to run as a Windows Service logged on with the gMSA account. The gMSA account requires access to the SQL instance.
d
If the given SQL PI repository user does not have sufficient privileges, the Insufficient Privileges
dialog will be displayed. Enter an admin user and password, and then click Grant Privileges.
9
Optional — In the Monitoring Extension pane, click the Operating System link.
10
Optional — In the Monitoring Extensions pane, click Collect VM statistics.
11
Click Monitor.

Discovering Multiple Instances to Monitor

You can use the instance installation wizard to discover existing instances. This option allows you to discover instances and monitoring them by entering several methods:

1
Click the SQL Server tab in the middle of the Databases View, and then click Monitor.
2
Click the Use this option to discover multiple SQL-Server instances link. The Select an Agent Manager dialog box appears.
3
Choose an Agent Manager host, click Validate to validate the Agent Manager system resources, and then click Next.
4
Click Add instances and select one of the following methods for adding instances:
7
Click Set credentials to provide the instances' log in credentials and monitoring configuration.
8
Follow the steps described in Installing and Monitoring a Single SQL Server Instance , starting with Step 5 to enter the monitoring credentials and enable the monitoring extensions for this instance.
NOTE: To use stored credentials when enabling the Operating System monitoring extension, click the Operating System > Select from stored credentials link to open the Stored Credentials dialog box. Here you can review the log in credentials and authentication methods used for logging in to Foglight. Foglight stores encrypted credentials in lockboxes, which may be password-protected for added security. Database agents store all user log in credentials in a default lockbox called DB-Agent Lockbox. If credentials have already been entered in another lockbox, use the Lockbox list to select from that lockbox.
9
Click Monitor
If the message is Insufficient database privileges, this issue can be resolved using the Insufficient Database Privileges dialog box that appears. For details, go to Step 10.
For all other messages, the Database Connection Failed dialog box appears. For details, go to Step 11.
10
Click the text Insufficient Database Privileges.
Enter a SYSAdmin user and password, and then click Grant Privileges. Alternatively, click the View script link, to the right of the Grant privileges button, to grant privileges manually with a script.
a
Click Show details to view the error’s description.
b
Click Set credentials to display the dialog box used for entering the credentials, and enter the required changes.
Related Documents

The document was helpful.

Select Rating

I easily found the information I needed.

Select Rating