The Misbehaving Clients tab displays the disconnections per count for a selected FglAM instance.
The following metrics are displayed for each agent:
|
• |
CDT Node Count: The number of internal data nodes produced by the CDT. Typically, there is one node for each topology object and its metrics, and one global (root) node in the tree. |
|
• |
CDT Value Count: The number of metrics and/or observations produced by the CDT. |
|
• |
Max Stack Depth: The depth of the data tree structure submitted by each agent instance. When a topology object in the data submission refers to another topology object, that increases the depth by one. When the second object refers to a third, the depth is increased again. |
|
• |
Node Count: The number of nodes in the submission. It is a measure of how large the data submission is. |
|
• |
Pre-processing time: The Agent Manager makes two passes over the data submitted by an agent. This is the time spent on the first pass, when the Agent Manager fills in references, validates the submission, calculates missing timestamps, and performs other pre-processing tasks. |
|
• |
Processing time: The length of time it takes the Agent Manager to transfer the data submission to the CDT processing engine of the Management Server. |
TIP: To restore the database after backing it up with the mysql command, use MySQL. To restore the database after backing it up with InnoDB HotBackup and applying the logs, shut down the Foglight Management Server, copy the backup files to <Foglight_home>/mysql/data, and start the Foglight Management Server
| |||||
| |||||
|
TIP: If you want to restore the database to a non-embedded PostgreSQL server, see the “Foglight Two Tier” section followed in this table. | |||||
| |||||
|
ZIP: zip -r Foglight.zip <Foglight_home>
TAR: tar -cvf Foglight.tar <Foglight_home>
TAR.GZ: tar -zcvf Foglight.tar.gz <Foglight_home>
TIP: To restore the database, copy the compressed file to the desired directory and extract this file to the installation directory. If you want to restore the database to a non-embedded PostgreSQL server, see the “Foglight Two Tier” section followed in this table. | |||||
| |||||
The default password is “foglight” that was set during the installation. The database information can be found in the server.database.* settings under <Foglight_home>/config/server.config.
| |||||
| |||||
The default password is “foglight” that was set during the installation. The database information can be found in the server.database.* settings under <Foglight_home>/config/server.config.
| |||||
|
1 |
|
a |
|
b |
Select the Processes tab to inspect the list of processes running on your system. |
|
3 |
|
1 |
Shut down the Foglight Management Server. In a Unix terminal window (for example, xterm) go to the <installation_dir>/bin directory, then type the following command: |
|
3 |
|
1 |
cd to the directory one level above the Foglight installation directory. |
|
NOTE: The archive must include the config, cartridge, support, license, and scripts directories and all their content. |
|
2 |
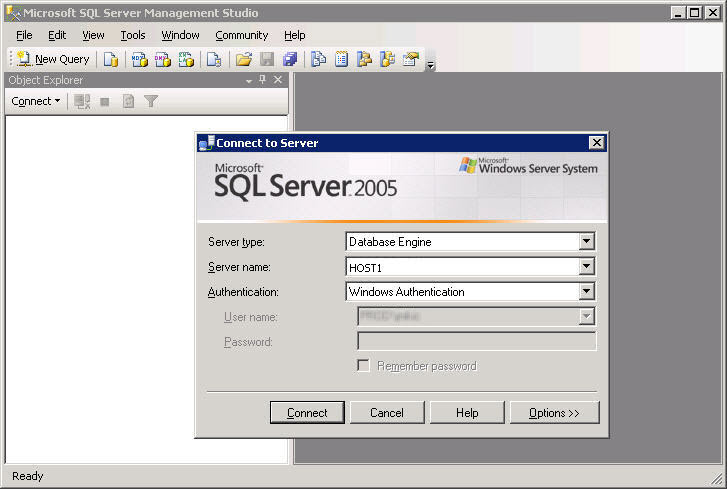
Start the Microsoft SQL Server Management Studio (Start > All Programs > Microsoft SQL Server 2005 > SQL Server Management Studio). |
|
a |
In the Connect to Server dialog box, use the following settings: |
|
b |
|
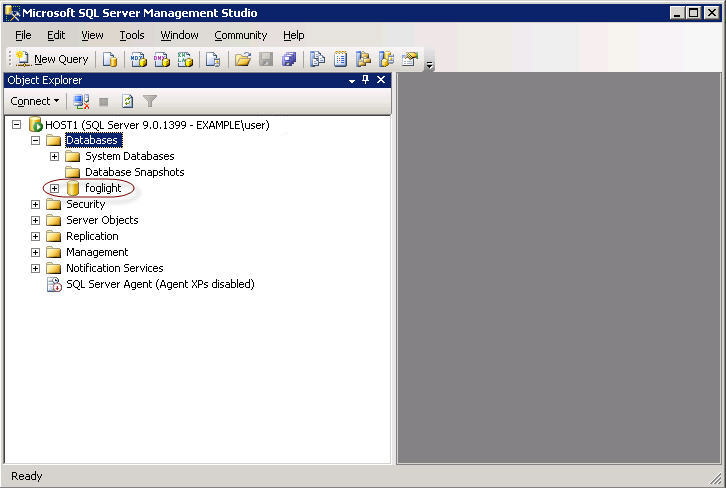
TIP: The Foglight database, represented by the foglight node in the Object Explorer tree, is installed on the MS SQL Server during the Foglight Management Server installation. For additional information, see the Installation and Setup Guide set. |
|
a |
In the Object Explorer pane, right-click the foglight node and from the cascading menus that appear, select Tasks > Backup. |
|
b |
Review the backup settings in the Backup Up Database—foglight dialog box, and if required, make additional modifications. |
|
TIP: The Backup Up Database—foglight dialog box includes two pages, each showing a different collection of settings: General and Options. By default, the General page is selected. To switch between the General and Options pages, select the appropriate page in the Select a page pane in the upper-left. |
|
c |
|
d |
|
6 |
|
2 |
|
a |
|
b |
Select Properties. |
|
c |
|
d |
|
2 |
|
• |
database_user is the name of the database user, as configured by the foglight.database.user parameter in <Foglight_home>/config/server.config. |
|
• |
database_port_number is the database port number, as configured by the foglight.database.port parameter in <Foglight_home>/config/server.config. |
|
• |
database_hostname_or_ip is the name of the computer on which the database is installed, or its IP address, as configured by the foglight.database.host parameter in <Foglight_home>/config/server.config. |
|
• |
database_name is the database name, as configured by the foglight.database.name parameter in <Foglight_home>/config/server.config. |
|
• |
--routines is a flag that ensures that all functions are included in the backup. |
|
• |
backupfile_name is the name of the backup SQL file. |
|
3 |
After the backup SQL file is created, stop the MySQL database by issuing the shutdownDb.bat command from the <Foglight_home>/bin directory. |
|
4 |
Verify that the database is down by verifying that the database process, mysqld.exe, is no longer running using the Task Manager. |
|
2 |
|
• |
|
• |
the backup location: backup.cnf |
|
• |
Foglight_home contains the path to the Foglight installation directory. |
|
• |
path_to_backup_data contains the path to the directory that is to contain the backup files, as defined in Step 1. |
|
3 |
|
NOTE: The above example illustrates the process of backing up a MySQL database on Windows, which uses the back slash character as a directory separator and the dir command to list files. On Unix platforms, use the forward slash to separate directories and the list -l command. |
|
NOTE: The example bellow illustrates the process of backing up a MySQL database on Windows, which uses the back slash character as a directory separator and the dir command to list files. On Unix platforms, use the forward slash to separate directories and the list -l command. |
|
2 |
|
a |
In the Connect to Server dialog box, use the following settings: |
|
b |
|
TIP: The Foglight database, represented by the foglight node in the Object Explorer tree, is installed on the MS SQL Server during the Foglight Management Server installation. For additional information, see the Installation and Setup Guide set. |
|
a |
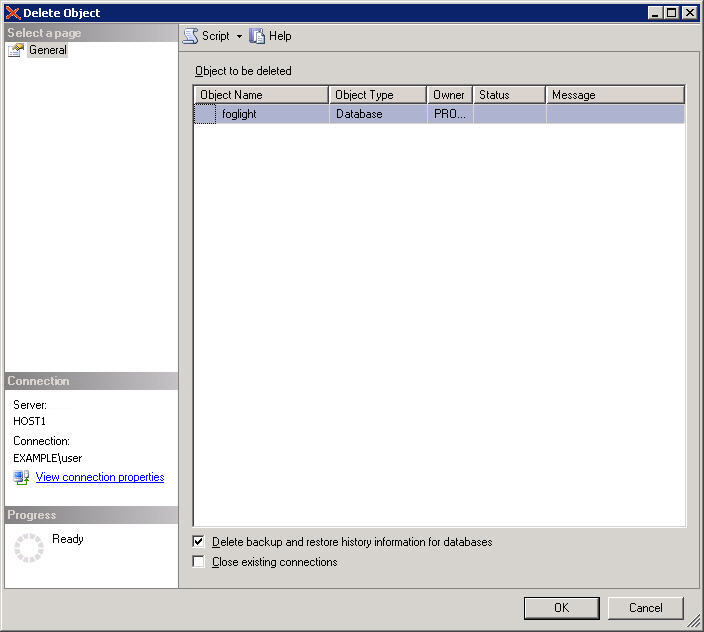
In the Object Explorer pane, right-click the foglight node and from the menu that appears, choose Delete. |
|
b |
Review the backup settings in the Delete Object dialog box, and if required, make additional modifications. |
|
c |
|
a |
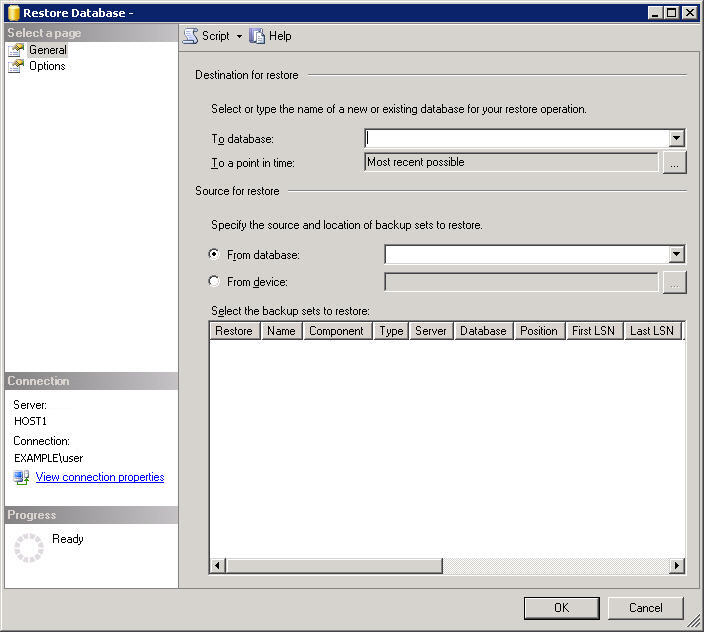
In the Object Explorer pane, right-click the Databases node and from the menu that appears, choose Restore Database. |
|
b |
|
TIP: The default location and name of this file is C:\Program Files\Microsoft SQL Server\MSSQL.1\MSSQL\Backup\foglight.bak. |
|
e |
|
g |
Review the remaining settings in the Restore Database dialog box, and if required, make additional modifications. |
|
h |
|
7 |
|
3 |
After running mysql -u root, execute the following SQL statement: |
|
IMPORTANT: In cases where there are multiple databases, it is important to specify which database this import is associated with by issuing the use <database> command. Failing to do so results in an error. |
|
4 |
After running mysql -u root, run the SQL script created by the backup. Use the following syntax: |
|
• |
Locate the oracle_drop_db.sql script in the scripts/sql directory of the server installation, and then start the script from the command line using the following syntax: |
|
NOTE: The files oracle_drop_dp.sql and oracle_drop_db.sql are included with Foglight when you use an Oracle database, The files are located in the <Foglight_home>/scripts/sql directory. |
|
• |
Issue the drop user command using the following syntax: |
|
NOTE: The dbdump file is the backup file you must create in order to restore your Oracle database (see To back up an Oracle database used by the Foglight Management Server:). |
|
TIP: Change the pg_hba.conf file to ensure that authentication method is password, if needed. For more information about PostgreSQL connections and authentication, see Connections and Authentication. |
|
7 |
Update the server.database.* settings under <folight_home_path>/config/server.config, in order to set up the connection between the Foglight server and the new database. |
|
TIP: Change the pg_hba.conf file to ensure that authentication method is password, if needed. For more information about PostgreSQL connections and authentication, see Connections and Authentication. |
|
7 |
Update the server.database.* settings under <foglight_home_path>/config/server.config, in order to set up the connection between the Foglight server and the new database. |
|
1 |
From the command-line, change directories (cd) to the directory where you want to install Foglight. |
|
5 |
The previous Foglight installation is now restored.
|
2 |
Copy the backup data that was created with the InnoDB tool, including the data files and the log files, to the directory <Foglight_home>/mysql/data. The backup data and log files use the following naming convention: |
|
• |
ibdata<1-n>. The name of the first data file is ibdata1, of the second ibdata2, and so on. The number of data files depends on the size of the backed up database. |
|
• |
ib_logfile<0-n>. The name of the first log file is ib_logfile0, of the second ib_logfile1, and so on. The number of log files depends on the size of the backed up database and the size of the log file specified in the backup configuration file, backup.cnf. |
If the host name changes, you must obtain a new Foglight license.To receive a new license, send an email to license@quest.com with your contact and site ID information, along with an explanation of why you need a license. Changing only the IP address, while the host name remains the same, does not require a license update.
If the host name changes, you must also update the CATALYST_URL registry variable. This registry variable contains the Management Server host name and port, which are used to build the alarm URLs sent in email message alerts. For more information about email settings, see Explore the Mail (Global Settings) view.
|
2 |
Back up the <Foglight_home> directory. |
|
3 |
Restore the backed up <Foglight_home> directory to the desired location on the new target machine. |
|
5 |
Host name changes only — Obtain a new license file and install it using the browser interface. |
|
6 |
|
2 |
Back up the <Foglight_home> directory. |
|
3 |
Restore the backed up <Foglight_home> directory to a desired location on the new target machine. |
|
5 |
Host name changes only. Obtain a new license file and install it using the browser interface. |
|
6 |
|
9 |
For more information on how to implement these configuration changes, visit the Support Portal at https://support.quest.com/.
By default, the following columns are displayed:
|
• |
Rule state: Indicates if the rule is enabled |
|
• |
Rule: Contains the rule name. |
|
• |
Copy: Creates a copy of the selected rule. |
|
• |
Disable (enabled rules only): Disables an enabled rule. |
|
• |
Enable (disabled rules only): Enables a disabled rule. |
|
• |
View and edit: Starts the workflow for viewing and editing rule details. |
|
• |
For expressions that do not include any registry variables, this column contains an icon |
|
• |
Other: Contains the value of any registry variables referenced by rule severity variables. |
|
• |
Alarms: Contains the number of alarms (multiple-severity rules only) generated by the rule. Clicking that column shows a list of alarms indicating for each alarm its severity, when the alarm was generated, and the alarm message. |
|
• |
Description: Contains the rule description. |
|
• |
Rulettes: The number of scoped objects to which the rule is bound. A rulette is a rule instance that represents the state of the monitoring object to which the rule condition applies. Clicking this column shows a list of all scoped objects. |
|
• |
Last Reset: The date and time of the most recent reset of the object’s state. |
|
• |
Triggers: The total number of times that the rule conditions evaluated the object instance. |
|
• |
Fired: The total number of times that the rule changed the state. |
|
• |
Hit: The total number of times that the rule conditions evaluated to True. |
|
• |
Miss: The total number of times that the rule conditions evaluated to False. |
|
• |
Last Fired: The most recent date and time when the rule changed the state. |
|
• |
Last Miss: The most recent date and time when a rule condition evaluated to False. |
|
• |
Cartridge: The name of the cartridge in which the rule is defined, including the cartridges included with the server, and any installed cartridges. This column is empty for rules that you create. |
|
• |
Cartridge Version: The version of the cartridge in which the rule is defined, including cartridges included with the server, and any installed cartridges. This column is empty for those rules that you create. |
|
• |
Last Modified Date: The date on which the rule was last modified. |
|
• |
Scope: This can give you a better idea on the effect that the rule has on your monitored system. The scope identifies one or more topology objects that the rule evaluates. If the scope is not defined, the rule runs against the entire data set, which can have a negative effect on overall performance. A rule can be scoped to a topology type and can optionally be scoped to specific topology objects of that type. For more information, see Rule scope. |
|
• |
Object Name: The name of the scoped object instance. |
|
• |
Unique ID: The ID of the scoped object instance. |
|
• |
Aggregate State: The state of the scoped object instance, representing the highest severity alarm state generated against this instance: Normal, Warning, Critical, or Fatal. |
|
• |
Type Name: The name of the topology type that the object is an instance of. |
Use the Enable and Disable buttons in the top-left to enable or disable selected rules.
To filter the list of rules by cartridge, click Cartridge in the top left and select a cartridge from the list that appears.
To access the Manage Rules dashboard, click Old Manage Rules. Use this dashboard to access an extended set of rule management tasks that cannot be initiated from the Rule Management dashboard, such as editing rule permissions, and suspending or resuming rule actions.
|
1 |
|
2 |
On the Rules dashboard, click the name of the rule that you want to copy, then click Copy from the context menu. |
|
3 |
In the Copy dialog box, specify the new rule name (optional, a default name already appears), indicate if you want to disable the original rule (default setting) or not, and indicate if you want to enable the new rule (default setting) or not. |
|
4 |
Click OK. |
|
NOTE: Some browser versions do not support the nested rendering of the Edit Rule page that you are about to access. If you are using those browser versions, click Launch in the display area, as prompted, to open the Edit Rule page in a new window or tab. |
|
5 |
Use the Edit Rule page to view and edit the rule definitions, as required. For more information, see Edit rule definitions. |
|
1 |
|
2 |
On the Rules dashboard that appears in the display area, click Old Manage Rules. |
|
NOTE: Some browser versions do not support the nested rendering of the Edit Rule page that you are about to access. If you are using those browser versions, click Launch in the display area, as prompted, to open the Edit Rule page in a new window or tab. |
|
4 |
|
1 |
|
2 |
On the Rules dashboard that appears in the display area, click Old Manage Rules. |
|
NOTE: Some browser versions do not support the nested rendering of the Edit Rule page that you are about to access. If you are using those browser versions, click Launch in the display area, as prompted, to open the Edit Rule page in a new window or tab. |
|
4 |
Click Delete Selected. |
|
5 |
Rules can be enabled and disabled using the Rule Management or the Manage Rules dashboard.
|
1 |
|
2 |
|
3 |
|
1 |
|
2 |
On the Rules dashboard that appears in the display area, click Old Manage Rules. |
|
NOTE: Some browser versions do not support the nested rendering of the Edit Rule page that you are about to access. If you are using those browser versions, click Launch in the display area, as prompted, to open the Edit Rule page in a new window or tab. |
|
4 |
Click the Disable Rules button at the bottom. |
|
5 |
|
1 |
|
2 |
|
3 |
|
1 |
|
2 |
On the Rules dashboard that appears in the display area, click Old Manage Rules. |
|
NOTE: Some browser versions do not support the nested rendering of the Edit Rule page that you are about to access. If you are using those browser versions, click Launch in the display area, as prompted, to open the Edit Rule page in a new window or tab. |
|
4 |
Click the Enable Rules button at the bottom. |
|
5 |
|
1 |
|
2 |
On the Rules dashboard that appears in the display area, click Old Manage Rules. |
|
NOTE: Some browser versions do not support the nested rendering of the Edit Rule page that you are about to access. If you are using those browser versions, click Launch in the display area, as prompted, to open the Edit Rule page in a new window or tab. |
|
4 |
Click the Suspend Alarms button at the bottom. |
|
5 |
In the Temporarily Suspend Rule Alarms dialog box, specify the time period for which you want to suspend alarms. |
|
1 |
|
2 |
On the Rules dashboard that appears in the display area, click Old Manage Rules. |
|
NOTE: Some browser versions do not support the nested rendering of the Edit Rule page that you are about to access. If you are using those browser versions, click Launch in the display area, as prompted, to open the Edit Rule page in a new window or tab. |
|
4 |
Click Resume Alarms. |
|
5 |
|
1 |
|
2 |
On the Rules dashboard that appears in the display area, click Old Manage Rules. |
|
NOTE: Some browser versions do not support the nested rendering of the Edit Rule page that you are about to access. If you are using those browser versions, click Launch in the display area, as prompted, to open the Edit Rule page in a new window or tab. |
|
4 |
Click Suspend Actions. |
|
5 |
In the Temporarily Suspend Rule Actions dialog box, specify the time period for which you want to suspend actions. |
|
1 |
|
2 |
On the Rules dashboard that appears in the display area, click Old Manage Rules. |
|
NOTE: Some browser versions do not support the nested rendering of the Edit Rule page that you are about to access. If you are using those browser versions, click Launch in the display area, as prompted, to open the Edit Rule page in a new window or tab. |
|
4 |
Click the Resume Actions button at the bottom. |
|
5 |
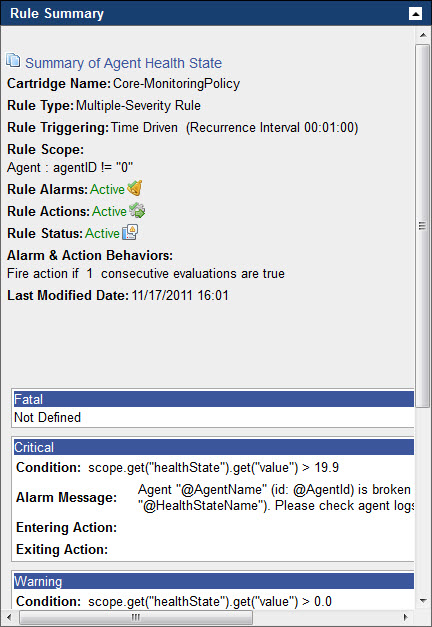
The Rule Summary pane includes the following information:
|
1 |
|
2 |
On the Rules dashboard that appears in the display area, click Old Manage Rules. |
|
NOTE: Some browser versions do not support the nested rendering of the Edit Rule page that you are about to access. If you are using those browser versions, click Launch in the display area, as prompted, to open the Edit Rule page in a new window or tab. |
|
3 |
On the Manage Rules dashboard that appears, click the Rule Name column of the row containing the rule whose summary you want to view. |
|
4 |
|
NOTE: The appearance of the Rule Summary pane depends on the rule type, its severity levels, and other settings. In the above illustration, the rule whose settings appear in the Rule Summary pane is active. |
|
6 |
Move the mouse pointer over the Rule Summary pane. |
For each rule, the Rule Diagnostics dashboard shows the following information:
|
• |
Name: The rule name. |
|
• |
Scope: The rule scope. This can give you a better idea on the effect the rule has on your monitored system. The scope identifies one or more topology objects that the rule evaluates. If the scope is not defined, the rule runs against the entire data set which can have a negative effect on overall performance. A rule can be scoped to a topology type and can optionally be scoped to specific topology objects of that type. For more information, see Rule scope. |
|
• |
Trigger: The trigger type. This value affects the frequency at which the rule conditions are evaluated. The rule trigger gives you a general idea of the rule activity and the alarms it generates. For example, a default data-driven trigger causes the rule conditions to be evaluated every time the data associated with the rule is collected and higher data sampling frequencies result in a higher number of alarms being generated. For more information, see Rule triggers. |
|
• |
Rulettes: The number of scoped objects to which the rule is bound. A rulette is a rule instance that represents the state of the monitoring object to which the rule condition applies. |
|
• |
Cartridge: The name of the cartridge in which the rule is defined, including the cartridges included with the server, and any installed cartridges. This column is empty for those rules that you create. |
|
• |
Cartridge Version: The version of the cartridge in which the rule is defined, including cartridges included with the server, and any installed cartridges. This column is empty for those rules that you create. |
|
• |
Enabled: Indicates if a rule is enabled or disabled. When a rule is disabled, its conditions are not being evaluated which prevents the rule alarms from being generated. For example, if Foglight is collecting any data that, under normal circumstances, result in alarm generation. Failing to generate alarms can be an indication that the rule is disabled. Rules are often brought offline during system maintenance periods. |
From here, you can drill down to a rule to see additional diagnostics about that rule. To do that, click the row containing the specific rule and, in the dwell that appears, under Go to, click Diagnostic Details.
|
TIP: To edit rule definitions, in the dwell, click Edit Rule and edit the rule as required. For more information, see Getting started: create a new rule. |
For more information about the Diagnostic Details view that appears, see View diagnostic details for a rule.
This composite view contains the following embedded views:
| |||
| |||
| |||
| |||
| |||
| |||
| |||
| |||
| |||
| |||
| |||
|
|
Lists one or more object instances to which the rule is bound, and shows information about the rule activity, as it relates to each object instance. Selecting a table row shows additional statistics about the rule activity in the Rulette Details View. | |||
| |||
| |||
| |||
| |||
| |||
| |||
| |||
| |||
|
|
For the object instance selected in Rulettes for Rule View, this view shows detailed statistics about the rule execution, broken into severity levels. | |||
| |||
| |||
| |||
| |||
| |||
| |||
| |||
| |||
|
Some Foglight dashboards have reports associated with them. This allows you to run a report based on the current dashboard. You can generate the report using the Reports menu in the top-right corner.
The Rule Management dashboard is associated with the Rules Report. Run this report by choosing Rules Report from the Reports menu, and specifying the input parameters in the report wizard.
The report wizard provides more information about the Rules Report and instructions on how to set the input values. For more information about reports in Foglight, see the Foglight User Help.
Some Foglight dashboards have reports associated with them. This allows you to run a report based on the current dashboard. You can generate the report using the Reports menu in the top-right corner.
The Rule Diagnostics dashboard is associated with the Rules and Registry Variables Report. Run this report by choosing Rules and Registry Variables Report from the Reports menu, and specifying the input parameters in the report wizard.
|
1 |
|
2 |
On the Rules dashboard, click the Rule column of the row containing the rule whose definitions you want to view or edit. |
|
3 |
In the menu that opens, click View and Edit. |
|
• |
Management Server rules only. If the rule is defined in a cartridge that is comes included with the Management Server, the Confirm Edit Core Rule dialog box opens. |
|
NOTE: Some browser versions do not support the nested rendering of the Edit Rule page that you are about to access. If you are using those browser versions, click Launch in the display area, as prompted, to open the Edit Rule page in a new window or tab. |
|
4 |
|
NOTE: Some browser versions do not support the nested rendering of the Edit Rule page that you are about to access. If you are using those browser versions, click Launch in the display area, as prompted, to open the Edit Rule page in a new window or tab. |
|
5 |
Use the Edit Rule page to view and edit the rule definitions, as required. For more information, see Edit rule definitions. |
Many rules come included with Foglight and installed cartridges, including Agent Health State, BSM All Events, Catalyst Data Service Discarding Data, and many others. If the existing rules do not meet your needs, you can create a new one and add it to the rule collection.
|
1 |
Open the Create Rule dashboard. On the navigation panel, under Dashboards, choose Administration > Rules & Notifications > Create Rule. |
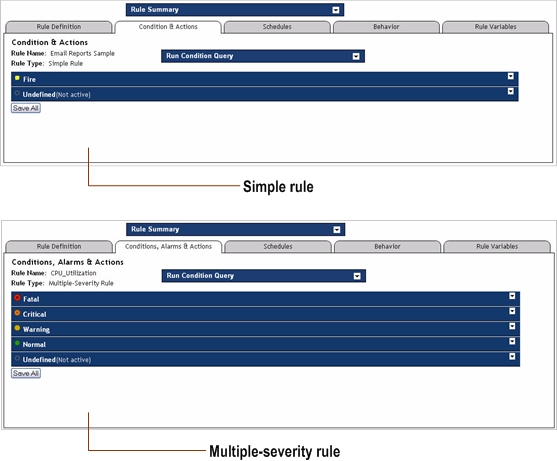
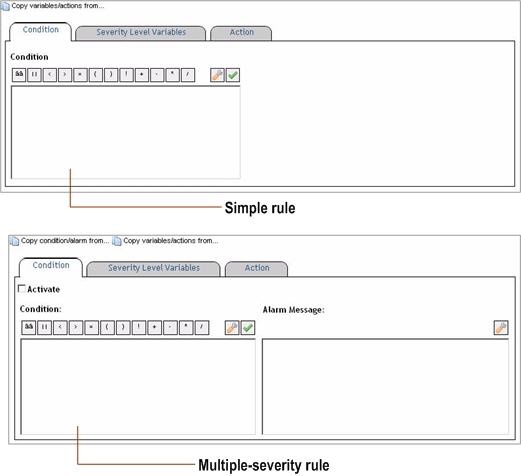
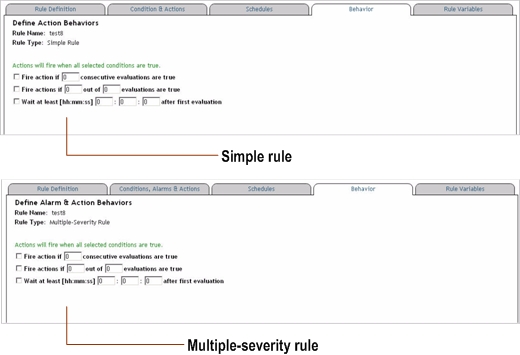
There are two types of rules in Foglight. Those types are Simple rules and Multiple-severity rules.
A simple rule has a single condition, and can be in one of three states:
|
• |
|
• |
A multiple-severity rule is a more complex type of rule that can have up to five severity levels:
|
• |
|
• |
|
• |
|
• |
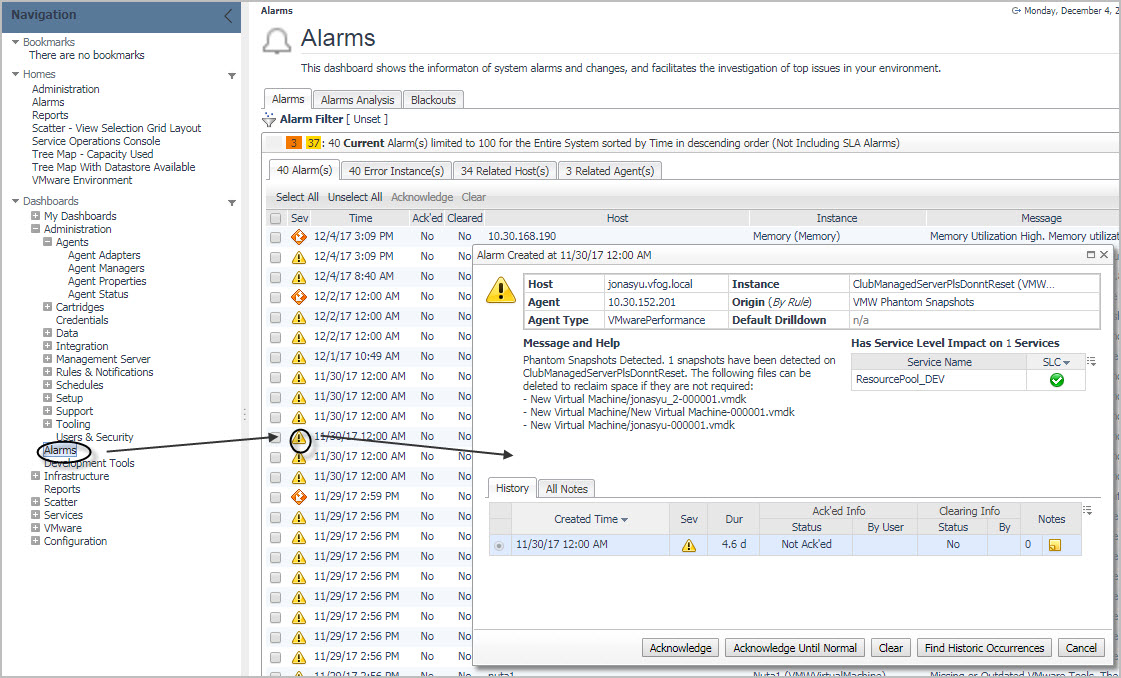
Each alarm can be acknowledged or cleared. Acknowledging an alarm indicates that the Foglight operator is aware of the alarm. You can acknowledge a single alarm instance (by clicking Acknowledge in the alarm drill-down dialog box), or all consecutive alarms generated by the same rule (by clicking Acknowledge Until Normal).
For more information about working with alarms, see the Foglight User Guide.
|
• |
AgentManagementSystemEvent: Foglight generates these types of events when an agent instance enters a certain state. Examples of agent states include New Instance, Registered, Unregistered, Activated, Deactivating, Data Collection Starting, Data Collection Stopping, and Obsoleted. These types of system events allow you to monitor the agents’ state and evaluate it in rule conditions. |
|
• |
AlarmSystemEvent. Multiple-severity rules generate system events when a rule severity level is reached, such as the Warning, Critical, or Fatal state. Alarm-based system events allow you to trigger alarm-related rules. This type of events can be useful, for example, when forwarding alarms to an external system or when sending notifications. |
|
• |
IncidentSystemEvent. Foglight creates an incident system event when an incident is created or modified. Incidents are used to group alarms based on a common parameter, and can result in ticket requests generated in an external system. The types of incident modifications you can evaluate in rule conditions include Create, Close, Acknowledge, Modify, and Delete. |
|
• |
ReportGeneratedEvent. Report generation creates events. You can monitor those events as required and use them to trigger report-related events.The type of report properties that you can evaluate in rule conditions include name, reportId, user, templateName, and many others. |
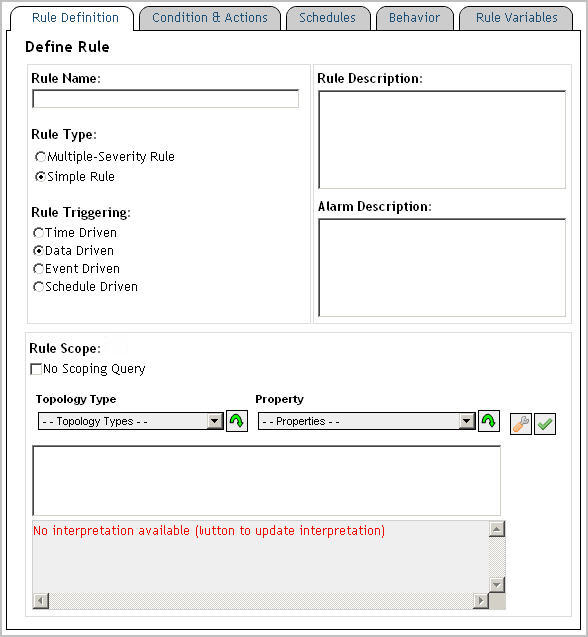
The scope of a rule defines the set of topology objects against which it runs. A rule can be scoped to a topology type and can optionally be scoped to specific topology objects of that type. If a rule is not scoped to specific objects, it applies to all instances of that type. The scope object is the object on which alarms will appear in the Foglight interface. The rule scope is specified using the query language. For more information, see Using the Query Language.
|
1 |
Open the Rule Definition tab. |
|
IMPORTANT: The following rule names are reserved and should not be used: foglight_rule_name foglight_rule_comments foglight_rule_domain_query foglight_rule_id foglight_monitored_host_name foglight_monitoring_agent_name foglight_rule_alarm_link foglight_scoping_id. The foglight_monitored_host_name and foglight_monitoring_agent_name variables are only available for rules with scoping queries. |
|
3 |
|
4 |
Optional — Add information about the nature of the alarm message. In the Alarm Description box, type the information about the alarm that is generated by the rule when predefined thresholds are reached. |
|
5 |
New rules only. Select the rule type. |
|
a |
|
b |
Specify the recurrence interval for the trigger in the hh:mm:ss format. |
|
c |
To evaluate the rule conditions on each interval, regardless of the existence of data, select Enable Trigger Without Data. |
|
• |
|
a |
|
a |
|
c |
|
7 |
In the Rule Scope area, define the rule scope. |
Rule expressions can reference different types of variables:
Foglight registry variables can be used in rule conditions, derived metric expressions, and rule-specific actions. A registry variable can have a global value that is available to all topology types and objects. It can also have one or more values associated with specific topology types or objects, or calendar dates. For more information, see Working with Foglight Registry Variables.
Foglight includes trigger-specific rule variables that can be used in conditional expressions of rules with certain trigger types. Each variable contains the information relative to the rule in which it is used. For example, if you create Rule A and use the rule-level variable foglight_rule_name as a parameter in an action that you add to Rule A, that parameter uses the actual rule name, Rule A.
Most of the rule variable are available in all contexts within a rule. However, foglight_rule_alarm_link, foglight_monitored_host_name, foglight_monitoring_agent_name and foglight_severity_message are not available in rule condition scripts. Also, foglight_severity_message is also not available at rule level. It is available only as severity level.
There are two types of rule-level and severity-level variables:
|
• |
Expressions. An expression is used to retrieve data. It can contain a registry variable or a function. |
|
• |
Messages. A message is typically a text string that can include other severity-level variables, displaying dynamically-supplied data about your monitored system. |
|
scope.get("agent/host/name") |
||
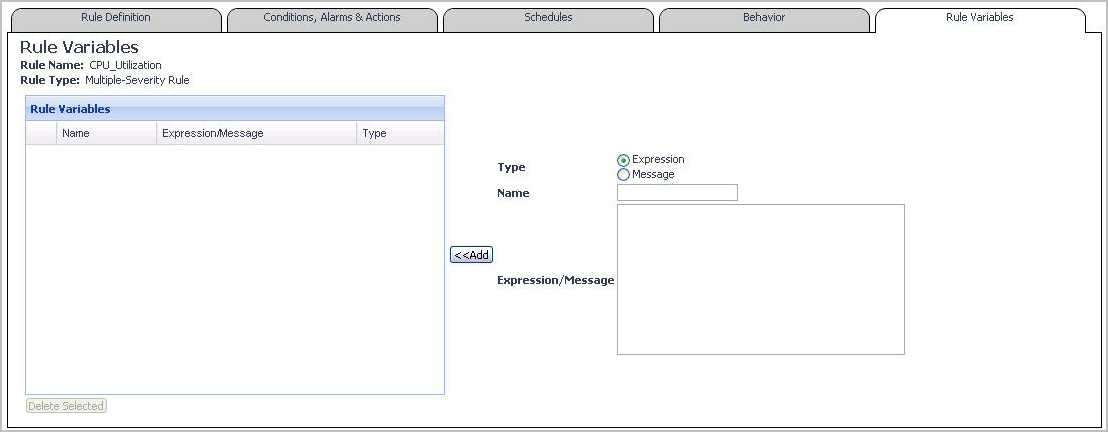
|
1 |
Open the Rule Variables tab. |
|
2 |
Define the type of the rule-level variable by selecting one of the following Type options on the right: Expression or Message. |
|
IMPORTANT: The following names are reserved and should not be used: foglight_severity_level and foglight_severity_level_name. |
|
5 |
Click Add. |
|
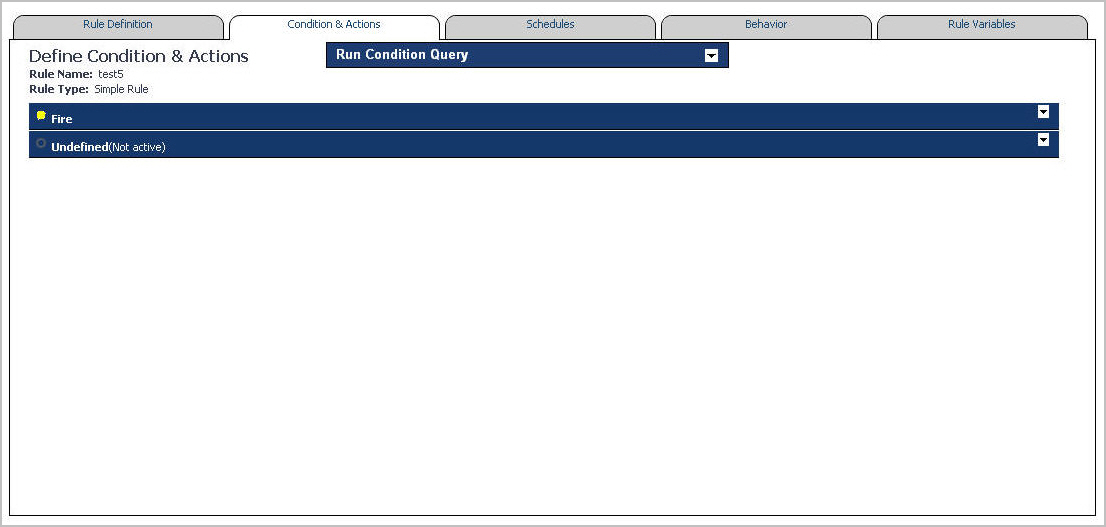
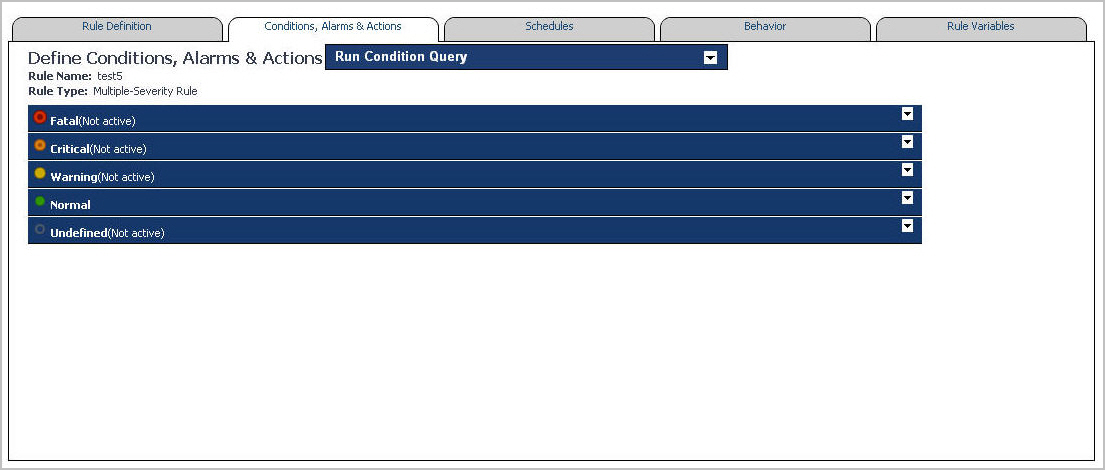
1 |
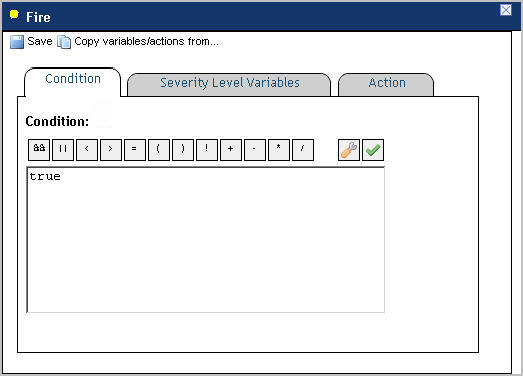
Open the Conditions, Alarms, and Actions tab (multiple-severity rules) or Conditions and Actions tab (simple rules). |
|
3 |
Select the Severity Level Variables tab. |
|
4 |
Define the type of the severity variable by selecting one of the following Type options on the right: Expression or Message. |
|
IMPORTANT: The following names are reserved and should not be used: foglight_severity_level and foglight_severity_level_name. |
|
7 |
Click Add. |
When you create a simple rule, you specify a single condition for it. You can edit this condition after you create the rule. When you create a multiple-severity rule, you must specify a condition for one or more of its severity levels, Fatal, Critical, and Warning, along with an alarm message that is associated with each condition.
Furthermore, event-driven rules can retrieve data generated by report- and alarm-related events.
Conditional expressions make use of the query language. For more information, see Using the Query Language.
Expressions and messages can be set with one of two distinct scopes: Rule-scoped expressions and messages and Severity-scoped expressions and messages.
They can be referenced by the actions set for the Fire and Undefined states of a simple rule and for all severity levels (Fatal, Critical, Warning, Normal, and Undefined) in a multiple-severity rule.
They can only be referenced by the actions set for the specific rule level at which the message is defined. For example, if an expression is defined for the Fatal level of a multiple-severity rule, it can only be referenced by the actions that are set for that severity level.
|
1 |
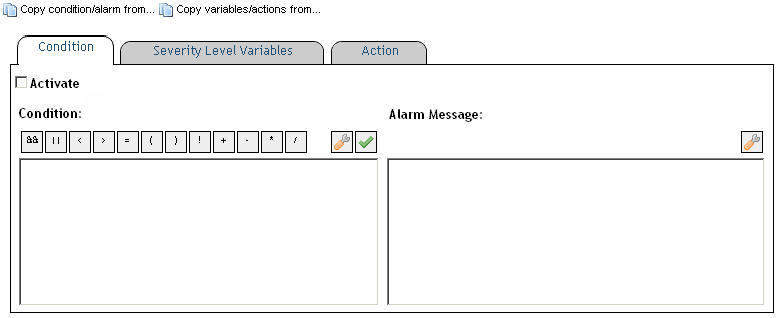
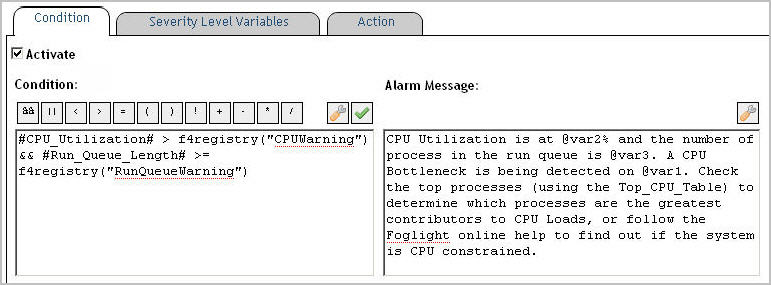
On the Conditions and Actions tab (simple rules) or Conditions, Alarms & Actions tab (multiple-severity rules), open the Conditions tab. |
|
IMPORTANT: Conditional expressions that reference metric properties using the syntax scope.get("aMetric") or metrics using the service layer (for example, server["DataService"].retrieveLatestValue(…)) prevent data-driven rules from firing. Similarly, failing to include a metric reference prevents data-driven rules from triggering. To reference a metric directly use the "#aMetric#" syntax. |
|
@event.get("report/name") == "MyReport"; | |||
|
@event.get("report/name") == "MyReport"; | |||
|
3 |
Multiple-severity rules. Activate the condition by selecting Activate. |
|
IMPORTANT: Do not clear the Activate check box if you want to temporarily disable a rule. To temporarily deactivate the alarms and actions for an entire rule, follow the instructions in Suspending or resuming rule alarms. You can also configure the behavior of the alarms and actions for the rule. See Configure alarm and action behaviorfor more information. |
|
4 |
Multiple-severity rules. Define the alarm message associated with the newly-defined condition. |
|
5 |
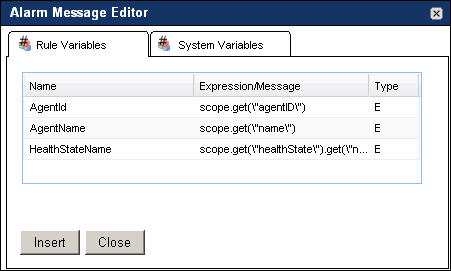
Multiple-severity rules (Optional). To reference a rule-level variable or a system variable in the alarm message, in the Alarm Message box, click the location in which you want to add the variable, and then click the Alarm Message Editor button ( |
|
• |
To add a rule-level variable, in the Alarm Message Editor dialog box, on the Rule Variables tab, select the rule-level variable and click Insert. |
|
• |
|
6 |
Event-driven rules allow you to monitor the events generated every time a pre-defined event occurs. There are several types of events that can act as rule triggers: AlarmSystemEvent, DatabaseMaintenanceEvent, IncidentSystemEvent, and ReportGeneratedEvent.
Multiple-severity rules generate system events when a rule severity level is reached. Foglight creates an AlarmSystemEvent object instance for each alarm system event. The types of rule severity include Undefined, Normal, Warning, Critical, or Fatal state. The change property of an AlarmSystemEvent object instance indicates the rule severity. Alarm-based system events allow you to trigger alarm-related rules. This can be done by evaluating the values of AlarmSystemEvent properties in rule conditions.
|
Specifies the alarm change type: Fire, Clear, Acknowledge or UserDefinedData. | ||
|
Determines if the event is acknowledged. It can be set to True or False. | ||
|
Determines if the event is cleared. It can be set to True or False. | ||
|
Indicates if the alarm is transitioning from the Warning, Critical, or Fatal state to Warning, Critical, or Fatal (as applicable). For new and clearing alarms, this value is always False. Foglight creates events for newly-created alarms, cleared alarms, or existing alarms transitioning to a new state, as follows: Clearing alarms generate a single Clear event with isTransition set to False. New alarms generate a single Fire event with isTransition also set to False. | ||
|
Clearing alarms generate a single Clear event with the next severity level of 0 (Normal). New alarms generate a single Fire event with the next severity level of 2 (Warning), 3 (Critical), or 4 (Fatal). Existing alarms transitioning from the Warning, Critical, or Fatal state to Warning, Critical, or Fatal generate two events: a Clear event for the old severity, and a Fire event for the new severity. The next severity level in both events is set to the target severity (Warning, Critical, or Fatal). | ||
|
Indicates the previous severityLevel the alarm is transitioning from. For new alarms, the previous severity level is always 0 (Normal). Foglight creates events for newly-created alarms, cleared alarms, or existing alarms transitioning to a new state, as follows: Clearing alarms generate a single Clear event with the previous severity level of 2 (Warning), 3 (Critical), or 4 (Fatal). New alarms generate a single Fire event the previous severity level of 0 (Normal). Existing alarms transitioning from the Warning, Critical, or Fatal state to Warning, Critical, or Fatal (as applicable) generate two events: a Clear event for the old severity, and a Fire event for the new severity. The previous severity level in both events is set to the original severity (Warning, Critical, or Fatal). | ||
|
Contains any comments associated with the rule that generates the alarm. | ||
|
Contains a number that identifies the severity level: 0: Normal 1: Fire 2: Warning 3: Critical 4: Fatal | ||
|
Contains one of the following values that identify the severity level: Undefined, Normal, Warning, Critical, or Fatal. | ||
Each AlarmSystemEvent object instance contains an AlarmChangeType object instance that stores information about the incident type. You can reference AlarmChangeType property values in rule conditions. For example:
|
An enumeration object that specifies whether this is a “Started” or “Ended” event. | ||
|
If a task fails, this property contains the associated error message. |
Foglight creates an incident system event when an incident is created or modified. Incidents are used to group alarms based on a common parameter, and can result in ticket requests generated on an external system. For each incident, Foglight creates an IncidentSystemEvent object instance. The types of incident modifications include Create, Close, Acknowledge, Modify, and Delete. The type of incident modification is indicated in the IncidentSystemEvent object’s change property. Incident-based system events allow you to trigger incident-related rules. This can be done by evaluating the values of IncidentSystemEvent properties in rule conditions.
Each IncidentSystemEvent object instance contains an IncidentChangeType object instance that stores information about the incident type. You can reference IncidentChangeType property values in rule conditions. For example:
Report generation creates system events. Foglight creates a ReportGeneratedEvent object instance for each report generation event. The type of report properties that you can evaluate include name, reportId, usertemplateName, and many others. Report properties are contained in the ReportGeneratedEvent object’s report property. Report-based system events allow you to trigger report-related rules. This can be done by evaluating the values of ReportGeneratedEvent properties in rule conditions.
|
Contains an object of the Report type. For complete information about creating and scheduling reports in Foglight, see the Foglight User Guide. | ||||
Each ReportGeneratedEvent object instance contains a Report object instance that stores information about a report. You can reference Report object properties in rule conditions. The following table lists the
|
The name of the schedule that is associated with the report. | ||
|
1 |
On the Conditions and Actions tab (simple rules) or Conditions, Alarms & Actions tab (multiple-severity rules), open the Conditions tab. |
|
• |
report indicates that you want to use the ReportGeneratedEvent in the conditional expression. |
|
• |
object is the name of the event's property object whose property value you want to retrieve. |
|
• |
property is the name of the event property that you want to use in the comparison. |
|
• |
some_value contains the value that is to be compared with the specified property value. |
|
3 |
Multiple-severity rules. Activate the condition by selecting the Activate check box. |
|
IMPORTANT: Do not clear the Activate check box if you want to temporarily disable a multiple-severity rule. To temporarily deactivate the alarms and actions for an entire rule, follow the instructions in Suspending or resuming rule alarms. You can also configure the behavior of the alarms and actions for the rule. See Configure alarm and action behavior for more information. |
|
4 |
Multiple-severity rules. Define the alarm message associated with the newly-defined condition. |
|
5 |
Multiple-severity rules (Optional). To reference a rule-level variable or a system variable in the alarm message, in the Alarm Message box, click the location to which you want to add the variable, and then click the Alarm Message Editor button ( |
|
• |
To add a rule-level variable, in the Alarm Message Editor dialog box, on the Rule Variables tab, select the rule-level variable and click Insert. |
|
• |
|
6 |
Copying a conditional expression from one severity to another without modifying it results in multiple conditions with the same expression. While this type of rule configuration is allowed, a confirmation message appears to make you aware of that. When such a condition is met, it triggers the higher severity. For example, if both Warning and Critical conditions have the same expressions, when that condition is met, the rule enters the Critical severity. An exception to this case is when the expressions resolve the same condition using a slightly different combination of characters. For example, abc>1, abc >1, and abc > 1 are considered different expressions, and as such are evaluated separately.
|
1 |
Open the Conditions, Alarms & Actions tab. |
|
2 |
|
a |
|
4 |
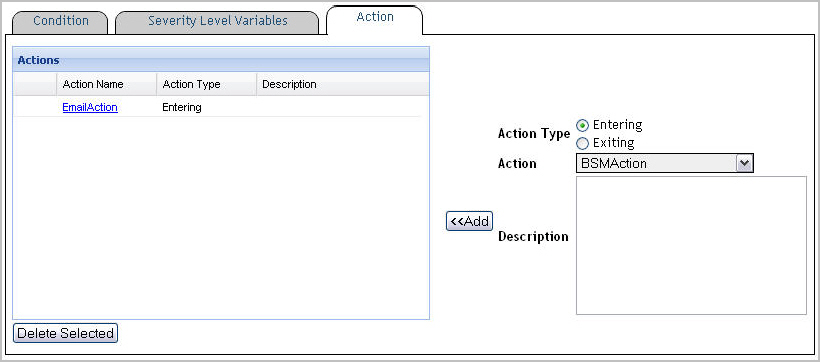
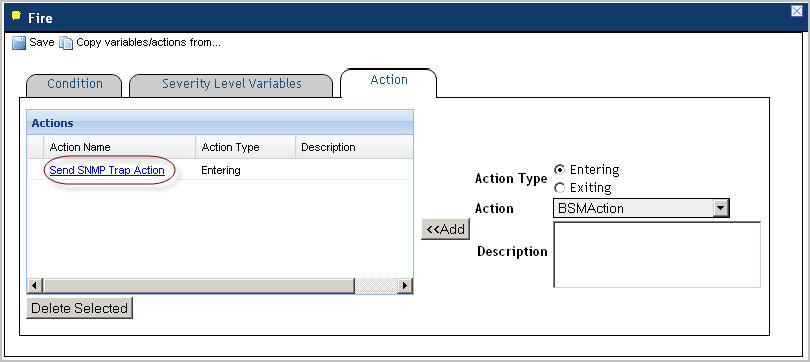
There are two types of actions in Foglight:
|
• |
Entering. It causes the action to be performed when a simple rule or a severity level in a multiple-severity rule enters the state in which the condition for that rule or severity level is met. |
|
• |
Exiting. It causes the action to be performed when a simple rule or a severity level in a multiple-severity rule exits the state in which the condition for that rule or severity level is met. |
The actions available in Foglight are as follows:
|
• |
BSM actions. Business Service Management (BSM) actions send alarm data to external systems such as Tivoli. |
|
• |
SNMP trap actions. They cause alarms to be forwarded as Simple Network Management Protocol (SNMP) traps to a management system that supports SNMP (such as Tivoli® NetView®, Micromuse NetCool® or HP® Vantage Point®) when the rule fires. Various parameters can be set for sending the SNMP trap, including the community, the host and port for the monitoring service. |
|
• |
Email actions. They cause email messages to be sent to a specified recipient when the rule fires. For more information about viewing the settings related to email actions and configuring email actions in Foglight, see Configuring email notifications |
|
• |
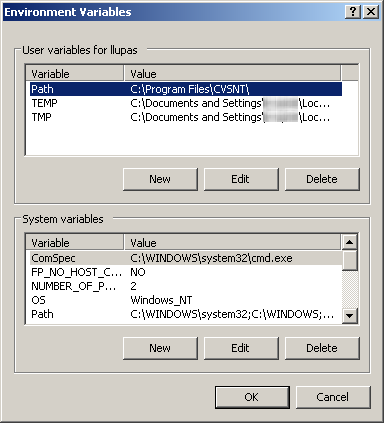
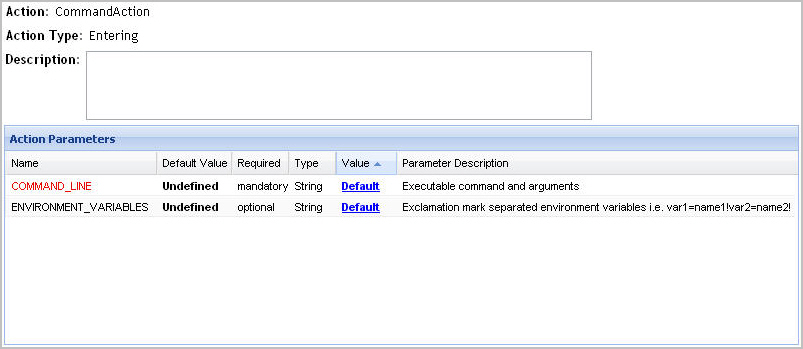
Command actions. They cause an external action to be executed on the computer on which the Foglight Management Server is installed. For example, a command action can run an executable that starts a service. Various parameters can be set for this action. The mandatory parameter is COMMAND_LINE which contains the name of the executable, along with one or more arguments. Optionally, you can also set OS environment variables (separated by exclamation marks). |
|
• |
Remote command actions. They cause an external action to be executed on a monitored host. Various parameters can be set for this action including the mandatory parameter COMMAND_LINE. |
|
• |
Script actions. They cause an arbitrary script, deployed inside the server (such as a Groovy script), that runs when the rule fires. This is to be used for any integration not available through built-in actions. Various parameters can be set for this action, such as script name (mandatory), scoping topology ID, scripting object ID, and arguments (up to ten) associated with the script. The number and order of arguments (0-9) specified as action parameters must match the script requirements. There is currently no validation facility for script actions. |
|
1 |
In the Conditions and Actions tab (simple rules) or Conditions, Alarms & Actions tab (multiple-severity rules), open the Action tab. |
|
5 |
Click Add. |
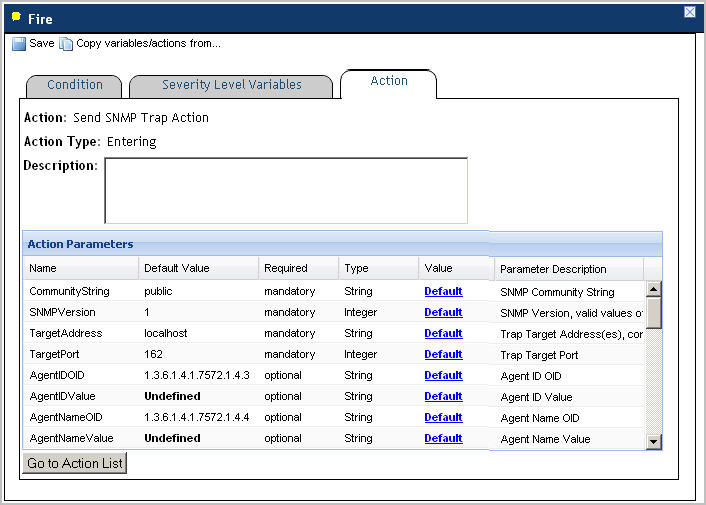
From here, you can edit the action parameters as required. For more information, see Editing rule action parameters.
The following rules apply to the command syntax for Command and Remote Command actions:
|
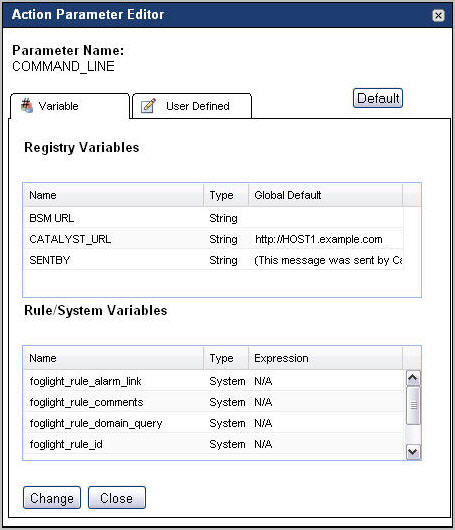
1 |
|
2 |
Observe the Type column of the row containing the parameter that you want to edit. |
|
IMPORTANT: The Type column shows the parameter’s data type. When changing the parameter value, ensure that the value you specify matches that data type. |
|
3 |
In the Action Parameters pane, in the row containing the parameter that you want to edit, click the Default link of that appears in the row’s Value column. |
|
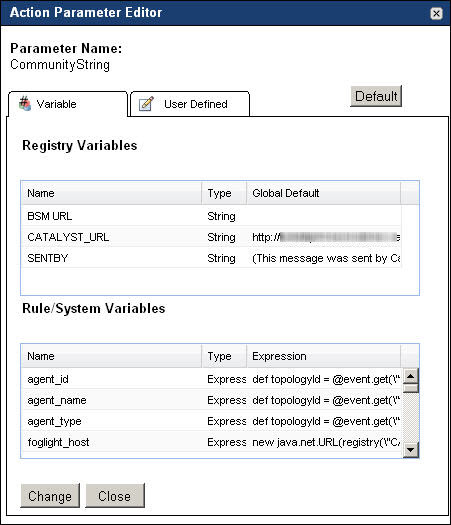
4 |
Specify the parameter value by completing one of the following steps in the Action Parameter Editor dialog box. |
|
5 |
Click Change. |
|
6 |
When you finish making changes to the action parameters, click Go to Action List to return to the list of actions. |
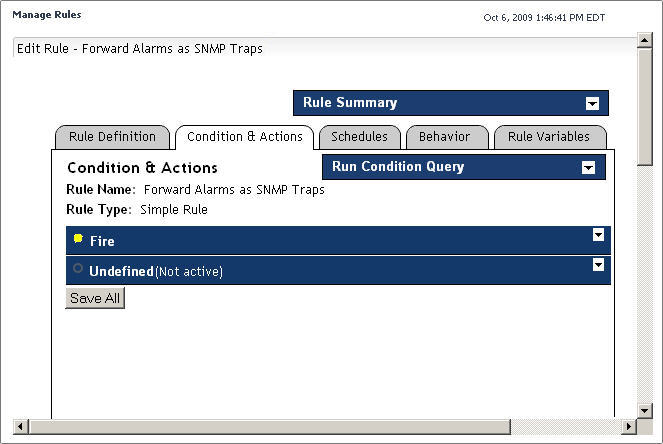
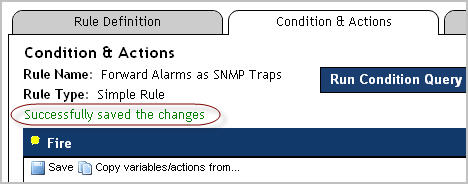
There are several ways that you can use to configure SNMP trap actions. The simplest and probably most convenient way is to edit the Forward Alarms as SNMP Traps rule that is included with a core installation of Foglight.
This rule relies on the definitions of the MIB file, quest-foglight.mib. Both the Forward Alarms as SNMP Traps rule and the quest-foglight.mib file are included in the Send-SNMP-Trap-Action cartridge, deployed during the Foglight Management Server startup.
This type of configuration involves editing the SNMP community string and the trap receiver’s IP address defined in the Forward Alarms as SNMP Traps rule. When configured, the rule sends traps that are formatted according to the settings specified in the SNMP trap action parameters. The rule contains an entering Send SNMP Trap Action with a set of pre-defined parameters that are compatible with the MIB file.
In addition to editing the SNMP community string and the trap receiver’s IP address, it is possible to define advanced SNMP settings, such as the trap target address or variable bindings using this rule. You can either edit, or copy and edit the Forward Alarms as SNMP Traps rule to meet your needs. Another option is to define SNMP traps in new or existing rules by adding an entering or exiting Send SNMP Trap Action to a rule, and edit the action’s parameters. This process typically requires advanced knowledge of the SNMP protocol and is beyond the scope of this guide. For more details, consult your SNMP documentation.
|
1 |
On the navigation panel, under Dashboards, choose Administration > Rules & Notifications > Rule Management. |
|
2 |
On the Rule Management dashboard, locate the Forward Alarms as SNMP Traps rule entry. |
|
3 |
Start editing the Forward Alarms as SNMP Traps rule. On the Rule Management dashboard, click the Rule column of the row containing the Forward Alarms as SNMP Traps rule. |
|
4 |
In the menu, click View and Edit. |
|
5 |
|
6 |
|
NOTE: Some browser versions do not support the nested rendering of the Edit Rule page that you are about to access. If you are using those browser versions, click Launch in the display area, as prompted, to open the Edit Rule page in a new window or tab. |
|
10 |
|
• |
Set the CommunityString parameter to contain your SNMP community string of the trap receiver. This test string acts as a password used to authenticate messages. For more information, refer to your SNMP documentation. |
|
• |
Set the TargetAddress parameter to the IP address of the trap receiving computer. |
|
a |
|
b |
Open the User Defined tab and type the SNMP community string (CommunityString parameter) or the SNMP trap receiver IP address (TargetAddress parameter), followed by clicking Change in the dialog box. |
|
1 |
Open the Conditions, Alarms & Actions tab. |
|
2 |
|
a |
Click Copy variables/actions. |
|
4 |
Verify the settings of the newly-copied severity-level variables and actions in the Severity Level Variables and Action tabs. |
|
5 |
|
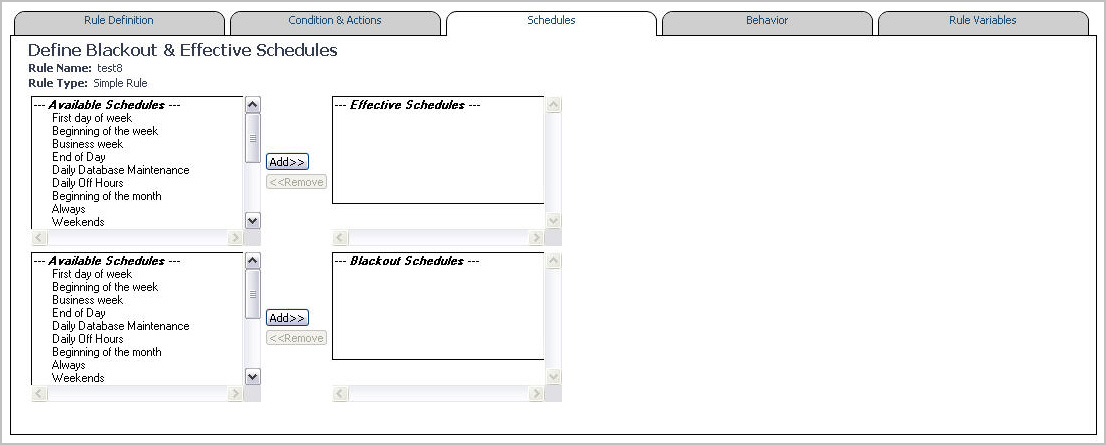
1 |
Open the Schedules tab. |
|
b |
Click Add on the right. |
|
b |
Click Add on the right. |
|
NOTE: Adding the Always entry to the list of blackout schedules does not create a black out for the rule. It has no effect on the rule’s blackout schedule. |
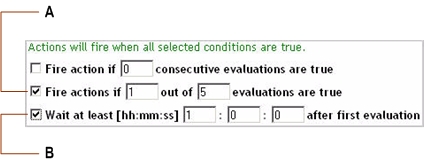
The following options are available:
|
• |
Fire action if x consecutive evaluations are true. Sometimes, observations are high-strung, causing a single match in the evaluation to lead to more actions than desired. With this option it is possible to enforce a certain number of positive evaluations before a rule finally fires. |
|
• |
Fire actions if x out of y evaluations are true. Similar to the above setting, this option allows to enforce a pattern of the evaluation behavior. When the frequency of positive evaluations matters less than their reoccurrence, this option allows for a less strict damper mechanism. |
|
• |
Wait at least [hh:mm:ss] hh:mm:ss after first evaluation. Sometimes when evaluations are performed immediately after a topology object creation, or the Foglight Management Server re-start, a number of false positives can occur. There might be a startup-time factor or the monitored entity simply needs to calm down for a minute or two, before reliable analysis can be performed. This option specifies that the first evaluation and all evaluations in the given time frame afterwards are ignored before evaluation results are considered. |
|
1 |
Open the Behavior tab. |
 |
||||
There are two types of rules in Foglight: simple rules and multiple-severity rules. A simple rule has a single condition, and can be in one of three states: Fire, Undefined, or Normal. A multiple-severity rule can have up to five severity levels: Undefined, Fatal, Critical, Warning, and Normal.
Rule conditions are regularly evaluated against monitoring data (metrics and topology object properties collected from your monitored environment and transformed into a standard format). Therefore, the state of the rule can change if the data changes. For example, if a set of monitoring data matches a simple rule’s condition, the rule enters the Fire state. If the next set does not match the condition, the rule exits the Fire state and enters the Normal state.
For more information see Configure Rules and Metric Calculations to Discover Bottlenecks .
|
NOTE: The Foglight Management Server also includes a rule that can be used to configure SNMP Trap Actions. For more information about this rule, see Forward Alarms as SNMP Traps rule. Foglight includes two kinds of trap actions: SNMP Trap Actions and Send SNMP Trap Actions. Both trap action technologies are currently supported, however the Send SNMP Trap Action is a new version of trap actions, and is recommended by Quest over the use of SNMP Trap Actions. Similar to SNMP Trap Actions, Send SNMP Trap Action can be configured using the Forward Alarms as SNMP Traps rule, described in this topic. |
This rule sends all alarms from Foglight to the Service Discovery and Dashboards product.
The BSM All Events rule includes an entering BSM action which includes two mandatory action parameters: Alarm system event and BSM URL. These parameters must be set in order for the BSM rule to work properly. By default, Alarm system event is set to the alarmEvent rule-level expression, while the BSM URL action parameter points to the BSM URL Foglight registry variable. To ensure this rule works as expected, you need to configure the BSM URL Foglight registry variable to the destination address, followed by enabling this rule (it is disabled by default).
For more information about the Service Discovery and Dashboards, see the product documentation.
|
A credential is currently valid but is to expire in five days or earlier. |
|
|
The Data Service discards one or more observations within a 15 minute interval |
This rule monitors the size of the database, checking whether the database size is higher than the predefined threshold, set by the DBSMon.MaxDatabaseSize registry variable. By default, this value is set to 100 Gb. If required, you can increase this value.
|
The size that is available to the Oracle database exceeds the threshold set by the DBSMon.WarningFreeTablespaceSize registry variable. |
|
|
The size that is available to the Oracle database exceeds the threshold set by the DBSMon.CriticalFreeTablespaceSize registry variable. |
|
|
The size that is available to the Oracle database exceeds the threshold set by the DBSMon.FatalFreeTablespaceSize registry variable. |
This rule periodically clears old LogFilter alarms.
|
The number of monitored hosts is higher than the number allowed by the license. |
(CatalystServer).jvm.garbageCollectors where name not like '%copy%'
|
The amount of time spent on garbage collection exceeds the threshold set by the registry variable FMSMon.gcWarn. The default value of that variable is 10. |
|
|
The amount of time spent on garbage collection exceeds the threshold set by the registry variable FMSMon.gcCritical. The default value of that variable is 30. |
|
|
The amount of time spent on garbage collection exceeds the threshold set by the registry variable FMSMon.gcFatal. The default value of that variable is 90. |
|
A license expires in the number of days set by the LicenseExpirationDaysWarning registry variable. By default, this number is 30. |
|
|
A license expires in the number of days set by the LicenseExpirationDaysCritical registry variable. By default, this number is 7. |
|
|
A license expires in the number of days set by the LicenseExpirationDaysFatal registry variable. By default, this number is 2. |
Checks if any attempts to create topology objects are failing because the topology size limit has been reached. This number is defined by the foglight.limit.instances registry variable whose global default value is set to 10,000. You can change this value if required.
|
CAUTION: Increasing the default value of the foglight.limit.instances variable may cause performance issues on the Foglight Management Server. If you need to increase this value, contact Quest Support for further instructions. |
CatalystTopologySizeConstraintService
|
The attempts to create topology objects are failing because the maximum number of topology objects exceeds the value set by foglight.limit.instances. |
This is a template rule that can direct all incoming SNMP traps to an SNMP trap receiver, once the rule’s Send SNMP Trap Action parameters, CommunityString and TargetAddress are set to point to the desired SNMP trap receiver.
You can use this rule as a template when creating rules with SNMP trap actions. For more information about viewing the settings related to SNMP trap actions and their configuration in Foglight, see Configure trap actions .
|
The agent is idle for the number of hours set by the registry variable IdleAgent.Warning. The default value of that variable is 1.0 hours. |
|
|
The agent is idle for a period of time set by the registry variable IdleAgent.Critical. The default value of that variable is 24.0 hours. |
|
|
The agent is idle for a period of time set by the registry variable IdleAgent.Fatal. The default value of that variable is 168.0 hours. |
Host : detail instanceof RemoteClient
|
No instance of the Foglight Agent Manager on a monitored host. |
|
An average availability during one hour period is below 95%. |
|
|
An average availability during one hour period is below 85%. |
|
|
An average availability during one hour period is below 70%. |