Chat now with support
Chat with Support

Spotlight on DB2 6.10 - User Guide

Spotlight on IBM DB2 LUW (Linux, Unix, and Windows)
New in This Release Getting started with Spotlight on IBM DB2 LUW Desktop features specific to Spotlight on IBM DB2 LUW Spotlight on IBM DB2 LUW drilldowns
About Spotlight on IBM DB2 LUW drilldowns Buffer Pool Analysis drilldown Client Application Analysis drilldown Database Analysis drilldown Database Manager Summary drilldown Diagnostic Log drilldown FCM Analysis drilldown Tablespace Analysis drilldown Top SQL drilldown Operating System drilldown Workload Management Analysis drilldown
Spotlight on IBM DB2 LUW alarms Spotlight on IBM DB2 LUW Options Tuning SQL statements in Spotlight on IBM DB2 LUW
Spotlight Basics
Spotlight Connections Monitor Spotlight Connections Alarms Charts, Grids And Home Page Components View | Options Troubleshooting
Spotlight History Spotlight on Windows
Connect to Windows Systems Background Information Home Page Alarms Drilldowns View | Options Troubleshooting
Spotlight on Unix About us Third-party contributions Copyright

CPU Panel


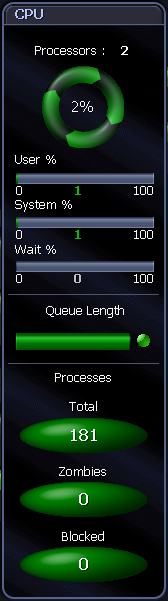
The CPU panel shows processor and load information for the Unix system:

Processors

Processors The number of CPUs in the machine you are diagnosing.
CPU Spinner The CPU load across all CPUs on the machine as a percentage.
User % The percentage of time the CPU is in the User state, across all CPUs.
System % The percentage of time the CPU is in the System state, across all CPUs.
Wait % The percentage of time the CPU is in the Wait state, across all CPUs. Wait is where the machine can only wait for I/O, or something similar, to complete.

Queue Length

The length of the queue in which processes are waiting to be executed. Processes in this queue will be run when the CPU becomes available.

Processes

Total The total number of processes that are running on the machine you are diagnosing.
Zombies The number of child processes whose termination has not been acknowledged by their parent process.
Blocked The number of processes waiting for some event or condition before they can continue execution.

Data flows between the Network panel and CPU panel

Network (Network to CPU)

Rate of incoming network data

The incoming rate of data to the server. Note: Spotlight contributes to the data traffic as part of its diagnostic activities.

Network (CPU to Network)

Rate of outgoing network data

The outgoing rate of data from the server. Note: Spotlight contributes to the data traffic as part of its diagnostic activities.

Network Errors (Network to CPU)

Rate of incoming network errors

The rate at which errors are received from the network.

Network Errors (CPU to Network)

Rate of outgoing network errors

The rate at which errors are sent from the machine to the network.

Data flows between the CPU panel and the Memory panel

The rate data is written to / from memory. The unit of measure is dependent on the Operating System.

Operating System Unit of Measure
Sun Solaris

Kilobytes per second

HP-UX

Pages per second

IBM AIX Pages per second
Linux

Kilobytes per second. Old versions of the kernel may measure in blocks per second. Refer to your Linux documentation.


Related Topics

Memory Panel


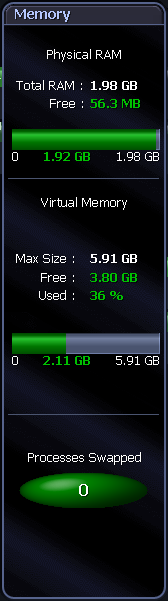
The Memory panel displays detailed information about the physical and virtual memory on the Unix system. It shows statistics such as:

Physical RAM

Total RAM

The total amount of memory in RAM chips.

Free

The amount of physical memory that is free.

Virtual Memory

Max Size

The total amount of virtual memory for the system.

Free

The amount of virtual memory that is free or unused.

Used %

The amount of virtual memory consumed, expressed as a percentage of the Max Size.

Processes Swapped

Where applicable, this is the number of processes whose pages have all been moved into swap space.

Data flows between the Memory panel and the CPU panel

The rate data is written to / from memory. The unit of measure is dependent on the Operating System.

Operating System Unit of Measure
Sun Solaris

Kilobytes per second

HP-UX

Pages per second

IBM AIX Pages per second
Linux

Kilobytes per second. Old versions of the kernel may measure in blocks per second. Refer to your Linux documentation.

Data flows between the Memory panel and the Swap Space panel

Swapping (Memory to Swap Space)

The rate at which processes are being swapped out to disk.

Swapping (Swap Space to Memory)

The rate at which processes are being swapped in from disk.

Data flows between the Memory panel and the Disk Activity panel

Disk I/O (Memory to Disk Activity)

The number of writes that the system makes to disk per second.

Disk I/O (Disk Activity to Memory)

The number of reads that the system makes from disk per second.


Related Topics

Swap Space Panel


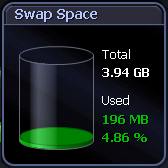
The Swap Space panel shows the configured swap space on the Unix system:

  • The total amount of configured swap space on the system.
  • The amount of swap space currently in use.

Data flows between the Memory panel and the Swap Space Panel

Swapping (Memory to Swap Space) The rate at which processes are being swapped out to disk.
Swapping (Swap Space to Memory) The rate at which processes are being swapped in from disk.


Related Topics

Network Panel


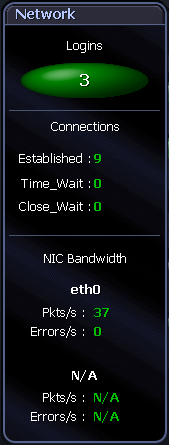
The Network panel shows the logins, connections and movement of data on the Unix system:

Logins

The number of users currently logged on to the machine you are diagnosing.

Connections

The number of external programs with which the machine is currently communicating. The types of connections are:

Established The total number of TCP/IP connections to this machine in the ESTABLISHED state.
TIME_WAIT

The total number of TCP/IP connections to this machine in the TIME_WAIT state, where the local socket has closed, and it is waiting for the remote end to signal that it has done the same.

CLOSE_WAIT The total number of TCP/IP connections to this machine in the CLOSE_WAIT state, where the remote end of the connection has shut down, and it is waiting for the local end to do the same.

NIC Bandwidth

Packets The rate of network packets being received and sent for the network card on this host that has the highest rate of packet transfers.
Errors The rate of erroneous network packets being received and sent for the network card that has the highest rate of packet transfers.
Packets

If more than one network card is installed on this host, this is the rate of network packets being received and sent for the network card that has the second-highest rate of packet transfers.

Errors If more than one network card is installed on this host, this is the rate of erroneous network packets being received and sent for the network card that has the second-highest rate of packet transfers.

Data flows between the Network panel and CPU panel

Network (Network to CPU)

Rate of incoming network data

The incoming rate of data to the server. Note: Spotlight contributes to the data traffic as part of its diagnostic activities.

Network (CPU to Network)

Rate of outgoing network data

The outgoing rate of data from the server. Note: Spotlight contributes to the data traffic as part of its diagnostic activities.

Network Errors (Network to CPU)

Rate of incoming network errors

The rate at which errors are received from the network.

Network Errors (CPU to Network)

Rate of outgoing network errors

The rate at which errors are sent from the machine to the network.


Related Topics

Related Documents

The document was helpful.

Select Rating

I easily found the information I needed.

Select Rating