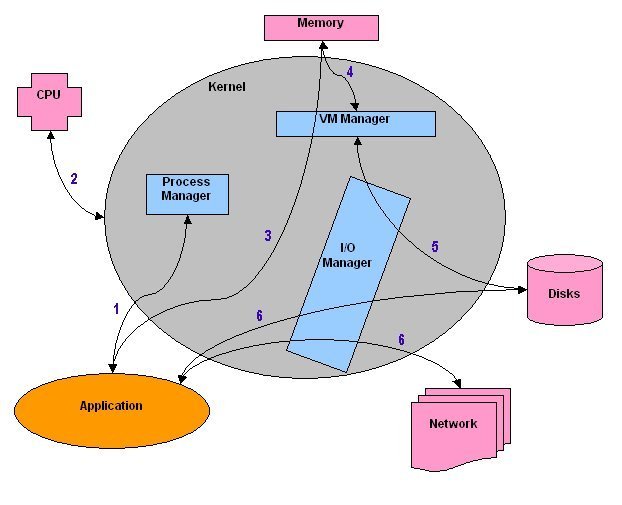
This diagram summarizes the architecture of Windows. This architecture is the basis for the design of the Spotlight home page. Spotlight Home Page
The Process Manager keeps track of processes and their threads. It is responsible for passing the threads to run on the CPU, although this is done through the Kernel.
The Process Manager has access to the low level subsystems through the Kernel. It has no direct access to any hardware.
The Virtual Memory Manager is responsible for managing the physical memory. This is done through the Kernel.
The Virtual Memory Manager is also responsible for Application Virtual Memory Address space. Applications cannot talk directly to underlying systems such as Physical Memory or CPU. Applications use the Virtual Memory Manager to talk to underlying systems.
The Virtual Memory Manager maps part of its Virtual Address space addresses to space in a disk page file. The Virtual Memory Manager has no direct access to hardware however, and must therefore pass its request through the I/O Manager.
The I/O Manager is responsible for talking directly to hardware components such network and disk.
The Virtual Memory Manager is responsible for keeping track of the Virtual Address Space, and what addresses are allocated. The Virtual Memory Manager is also responsible for managing system virtual memory on disk. It does this by calling various I/O Manager functions.
Spotlight is a powerful diagnostic and problem-resolution tool for Windows operating systems. Its unique user interface provides you with an intuitive, visual representation of the activity on the host machine.
For information on Spotlight on Windows, see these sections
| Section |
Description |
|---|---|
| Background Information |
Introductory material to Spotlight on Windows. |
| Connect to a Windows System | Create / Modify / Delete connections to Windows systems. |
| Home Page | The Spotlight home page shows the flow of information and commands between various sub-components and the size and status of internal resources such as processes, disk files and memory structures. |
| Alarms |
Spotlight alerts you to problems with your system by issuing an alarm. You can configure Spotlight in the level of severity that constitutes an alarm, to disable an alarm, and the actions Spotlight takes on raising the alarm. |
| Drilldowns | When you have isolated a problem, you can display a drilldown page, whose charts and tables provide a detailed breakdown of the underlying statistics. |
| View | Options | Customize Spotlight. |
| Troubleshooting | Solve problems using Spotlight. |
For information on using Spotlight applications See
The Spotlight home page shows the flow of information and commands between various sub-components and the size and status of internal resources such as processes, disk files and memory structures.
Related operating system statistics are grouped together on panels that are connected by a series of graphical flows and icons. Spotlight updates these flows in real time so you can see how quickly data is moving through the system. The icons change color as Spotlight alarms are raised, upgraded, downgraded and canceled.
The display is based on the Windows architecture diagram. Windows Architecture Overview
To see the Spotlight on Windows Home Page
 .
.