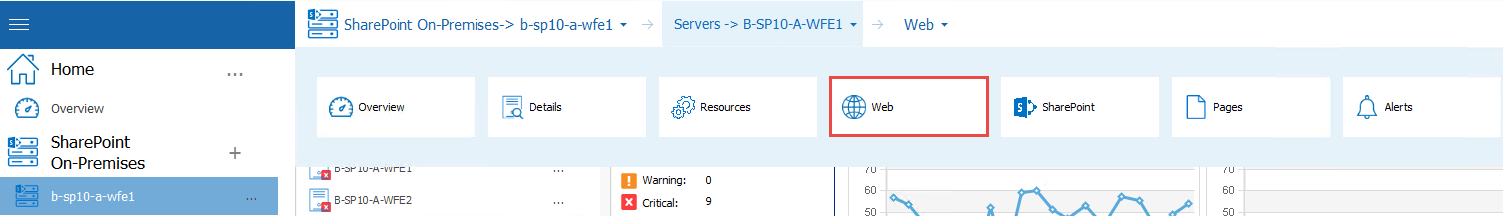
The Web tab of the Server section of the ribbon lets you review the status of the Internet Information Services (IIS) and Web Services components of the selected server. The data appears in graphical format, letting you easily review the status of the server and see patterns in your server behavior.
When you view the Web tab, you can select the amount of time represented by each graph. You can also choose to display current data or historical data from a time that you specify.
|
|
NOTE: The Web tab only appears if the selected server has IIS and Web Services installed and active. |
When Server Data is Collected
The Metalogix Diagnostic Manager Collection Service retrieves data from a server on a schedule that you specify in the Collection Service Options dialog box (see Setting the Collection Service Options). By default, the Collection Service retrieves this data every six minutes.
To view the status of server Web components:
1.In the Management Console select a server (that has IIS and web services installed) to open the overview for that server.
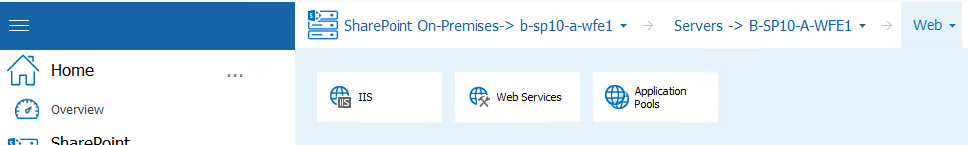
2.Select the server name to open the drop down options tab - select Web.
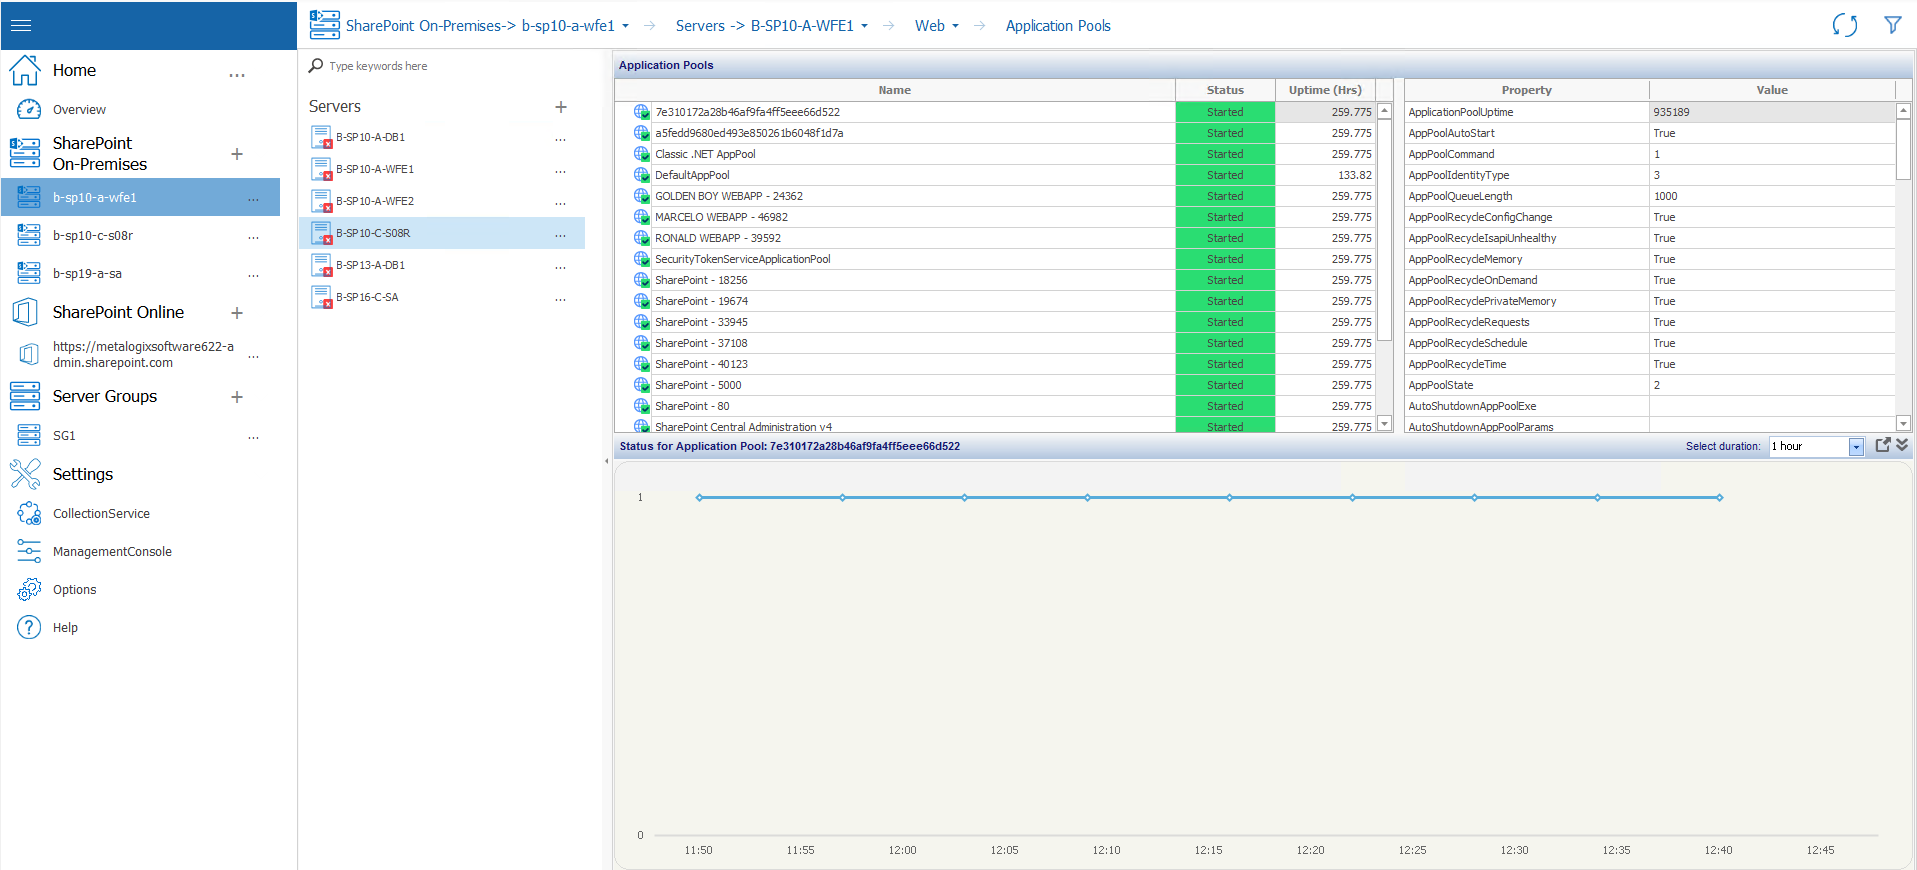
3.You can now choose between IIS, Web Services, and Application Pools.
Available Status Information
The Server Web tab includes the following information:
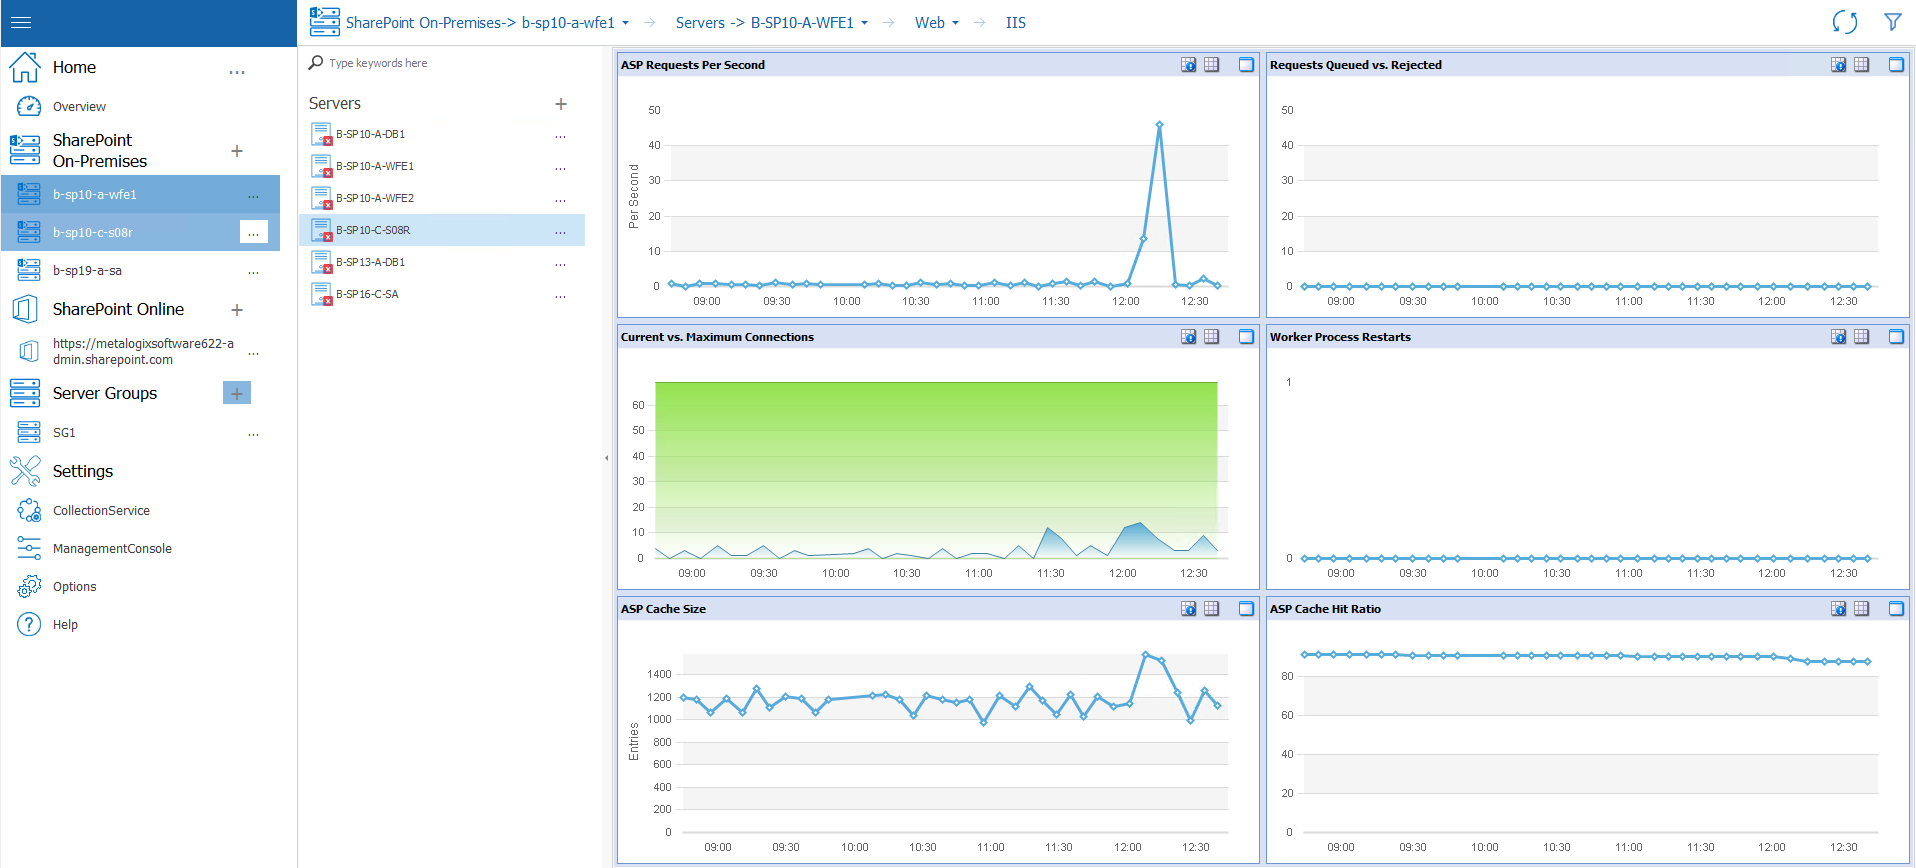
·Statistics about the IIS on the selected server
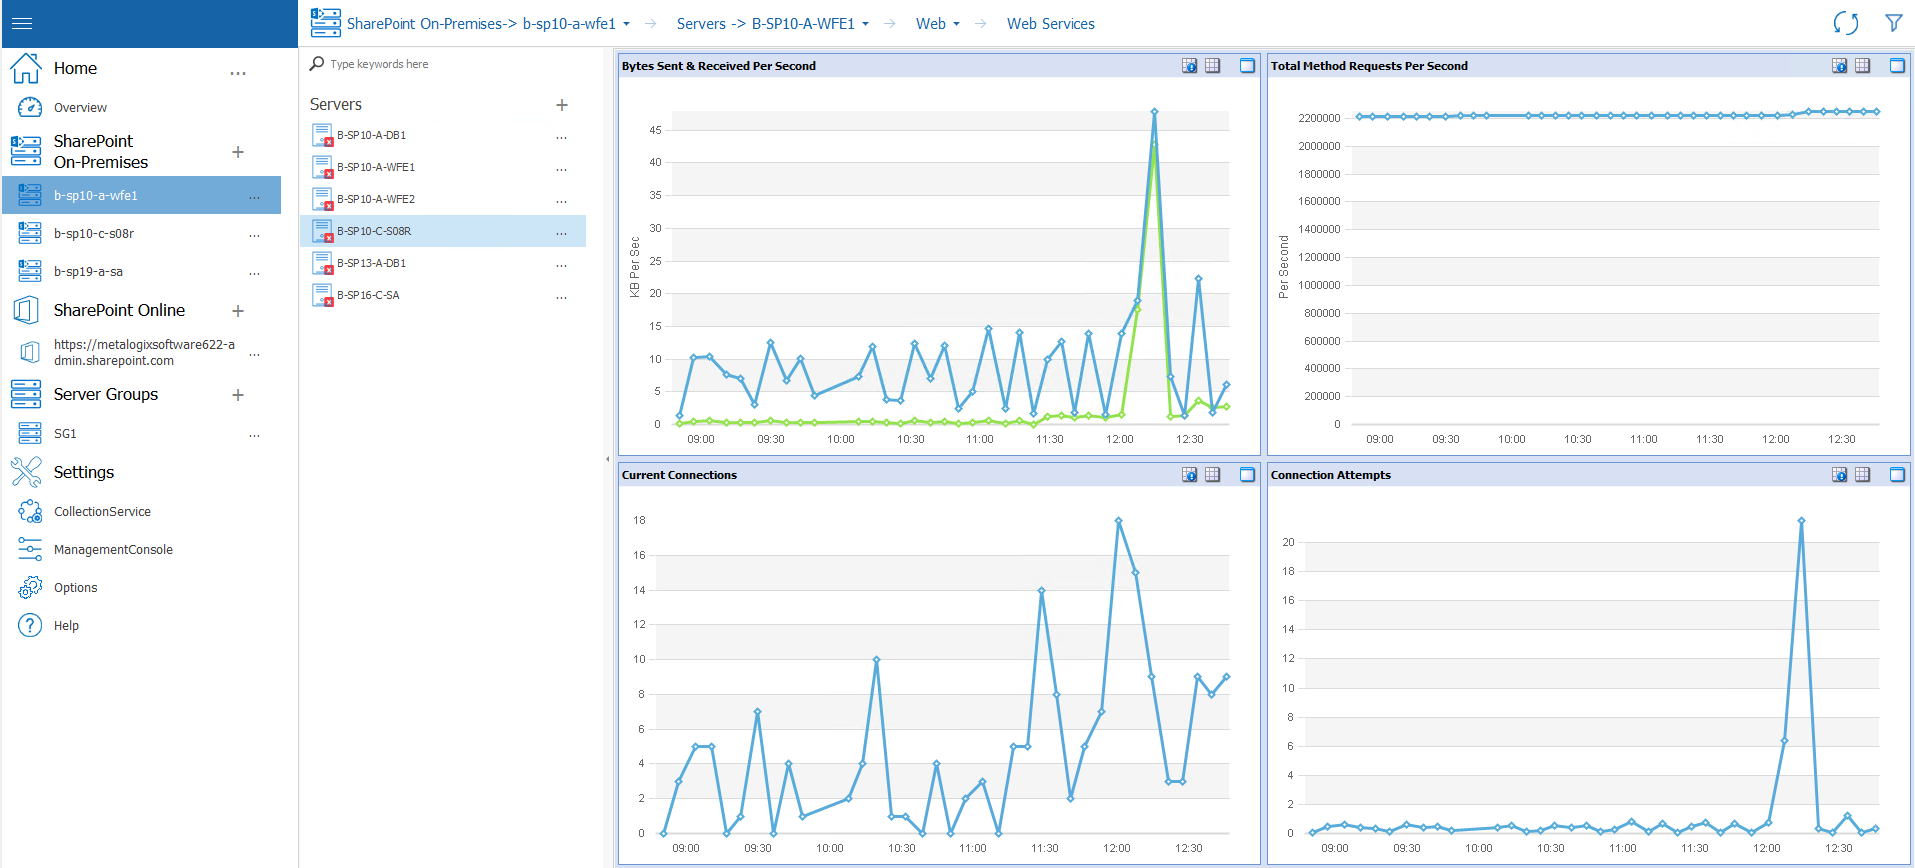
·Statistics about the Web Services on the selected server.
·The configuration and status of Application Pools on the selected server.
See also Working with Graphical Server Data.
The SharePoint tab of the Server view lets you easily review the status of a farm server and the SharePoint components that it hosts.
|
|
NOTE: The SharePoint tab only appears if the selected server has SharePoint components installed and active. |
To view the status of Server SharePoint components
1In the Management Console select the farm server (which has SharePoint components installed) whose SharePoint components you want to view.
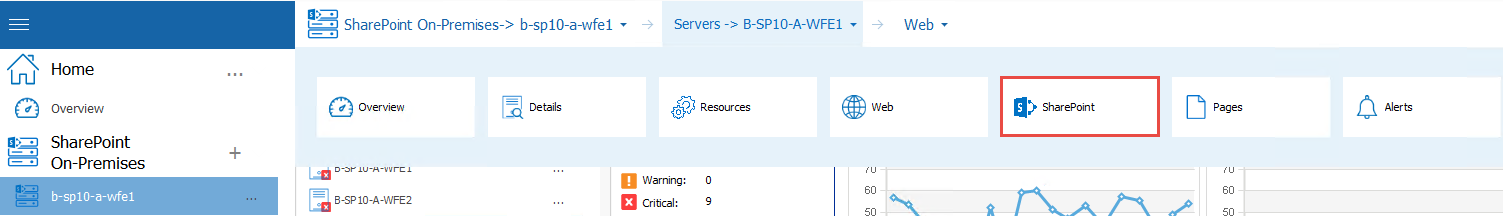
2Select the farm server name above the overview pane, a panel will appear, select SharePoint.
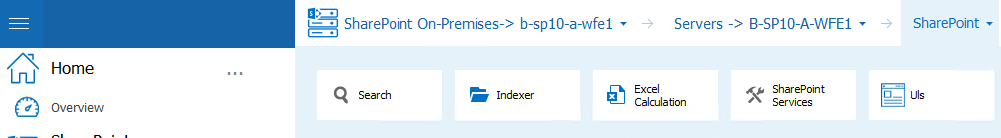
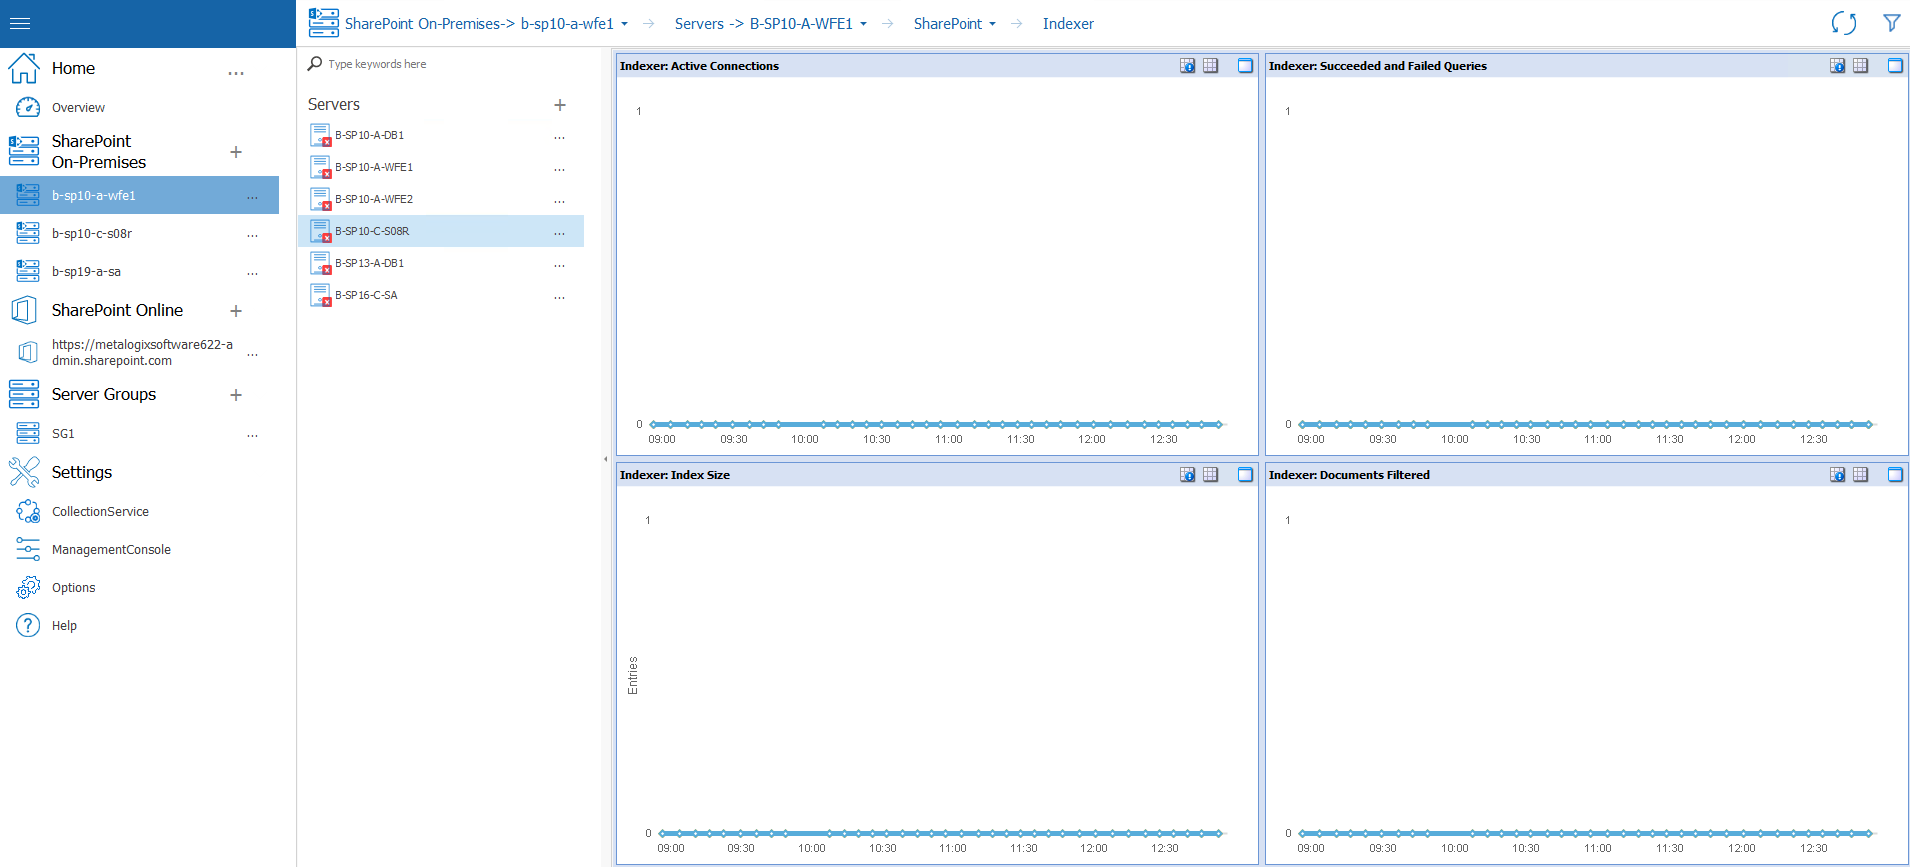
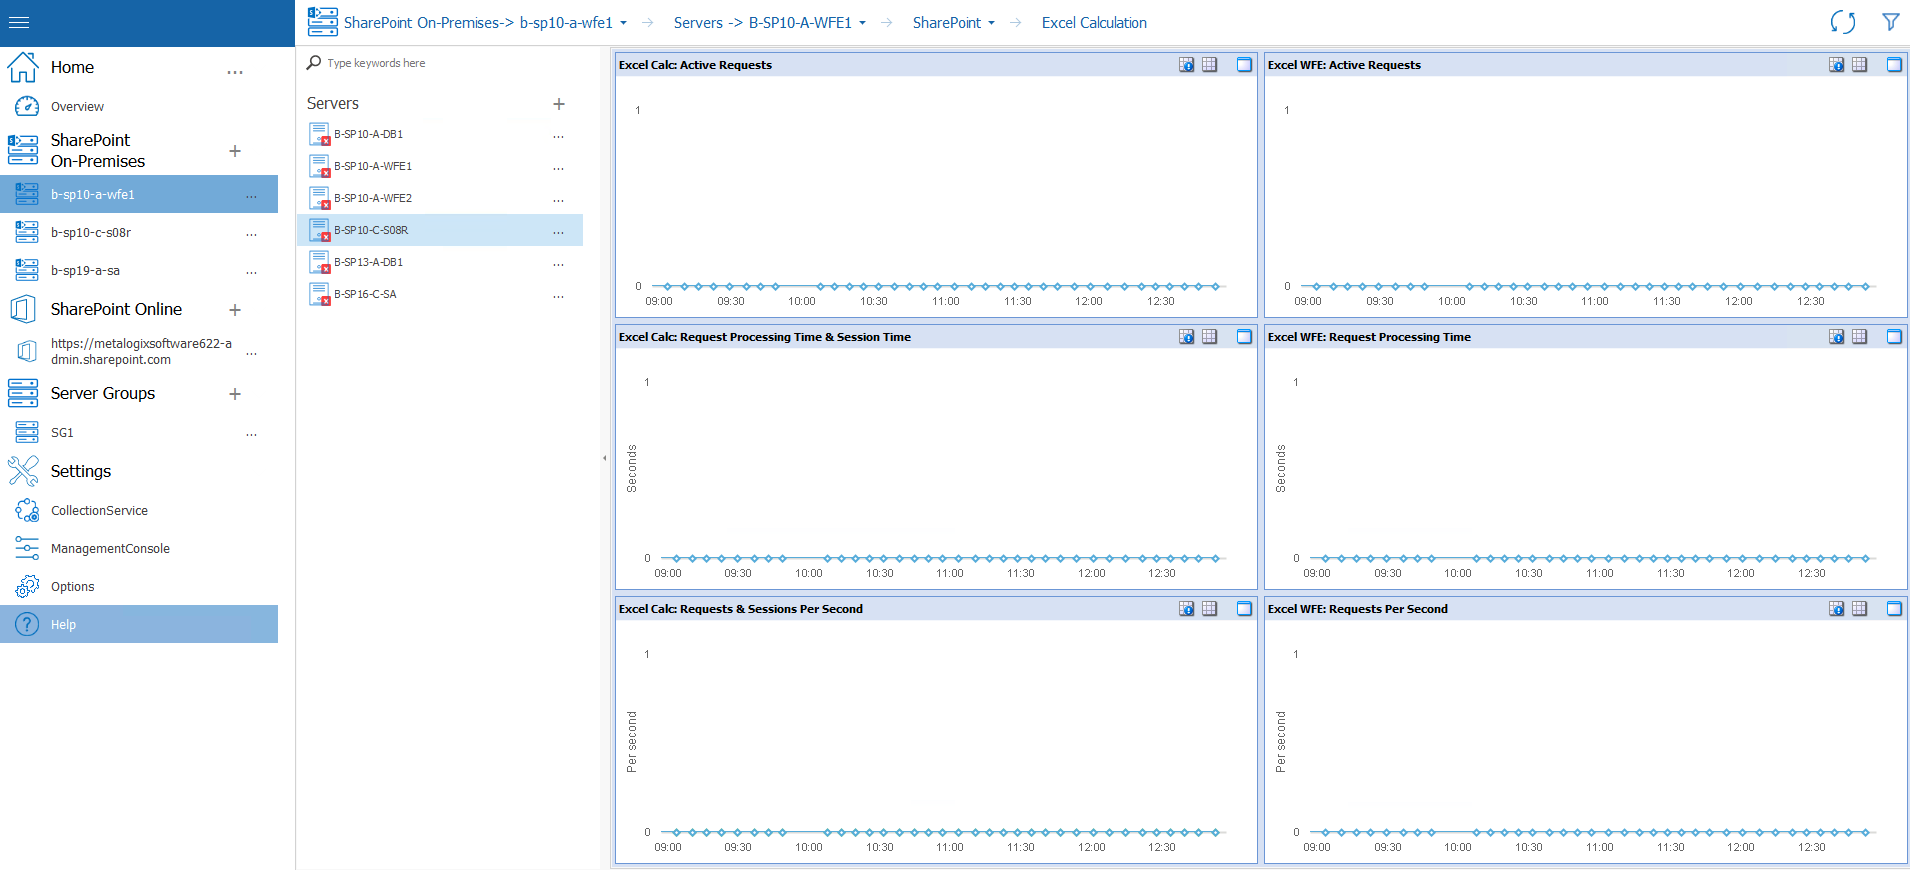
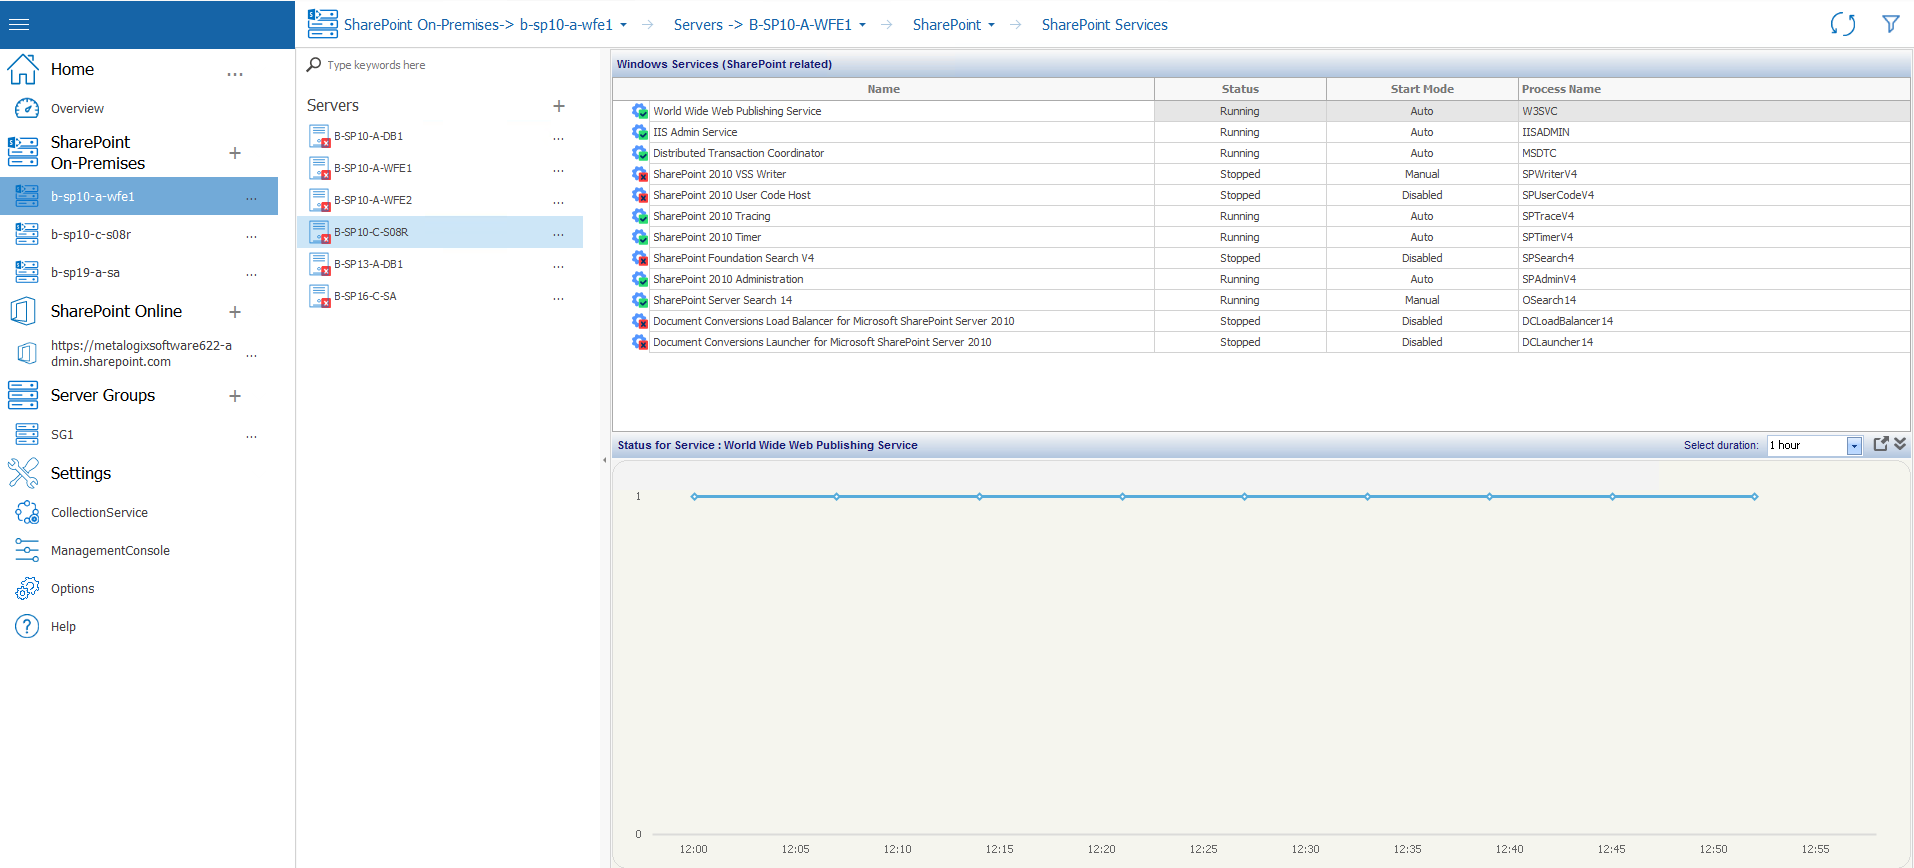
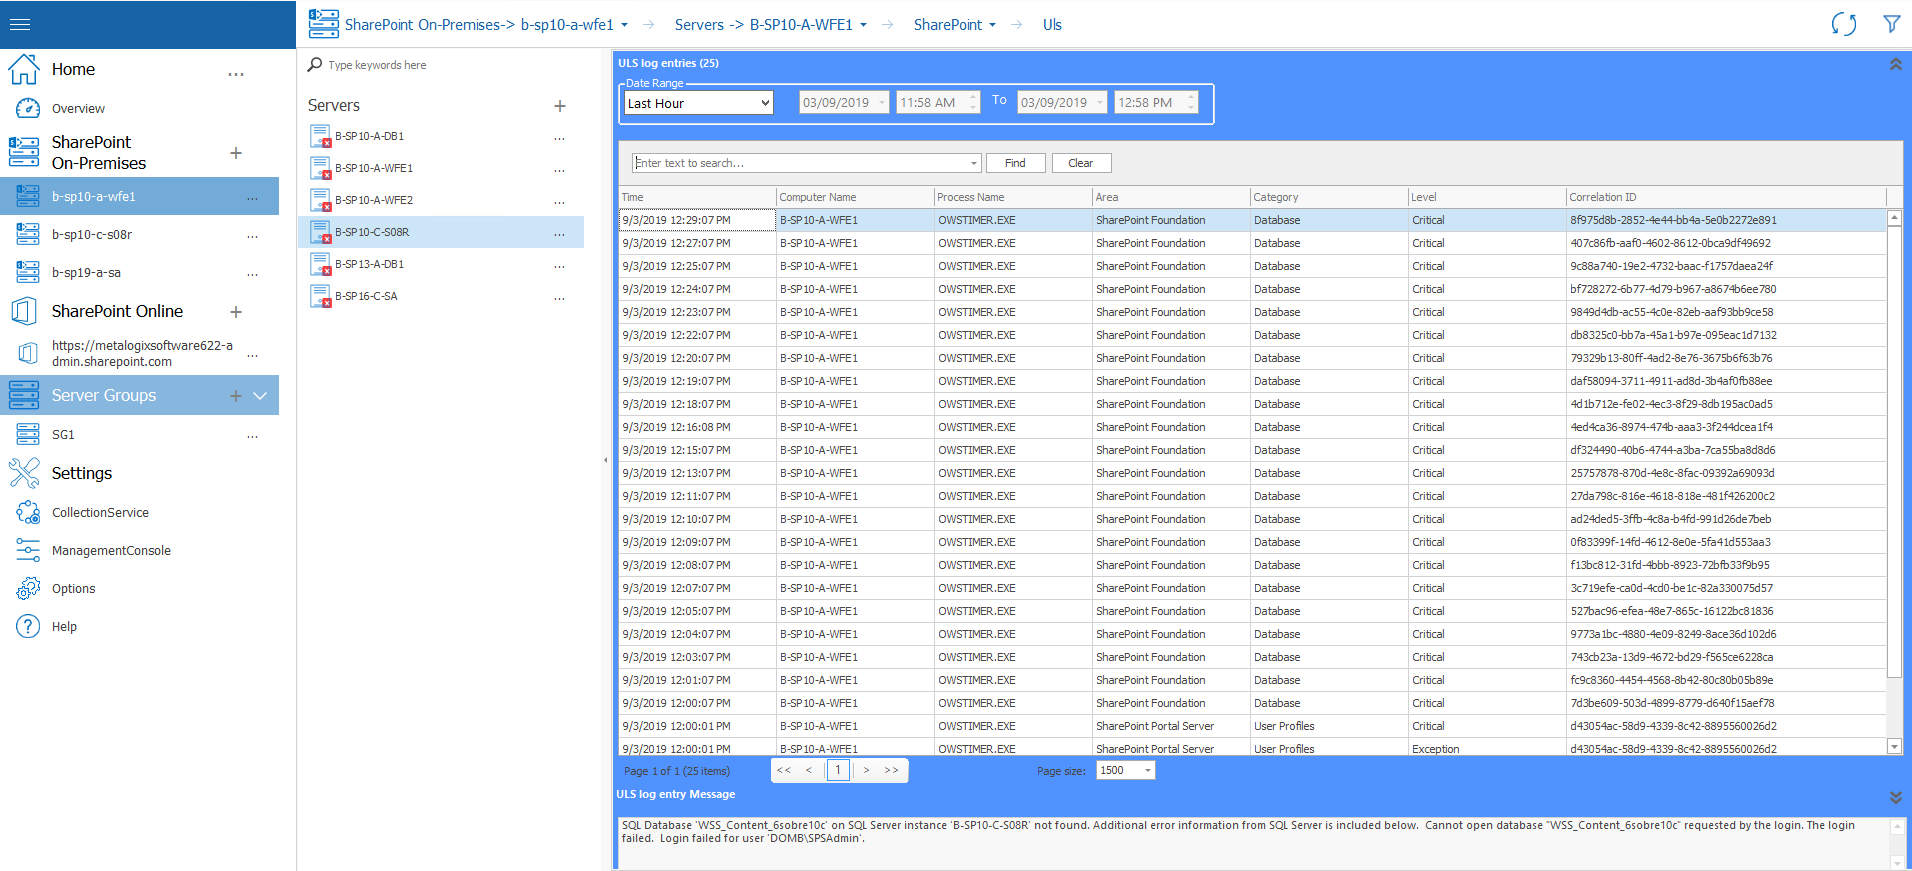
3You can now choose between Search, Indexer, Excel Calculation, SharePoint Services, and ULS.
The SharePoint tab includes:
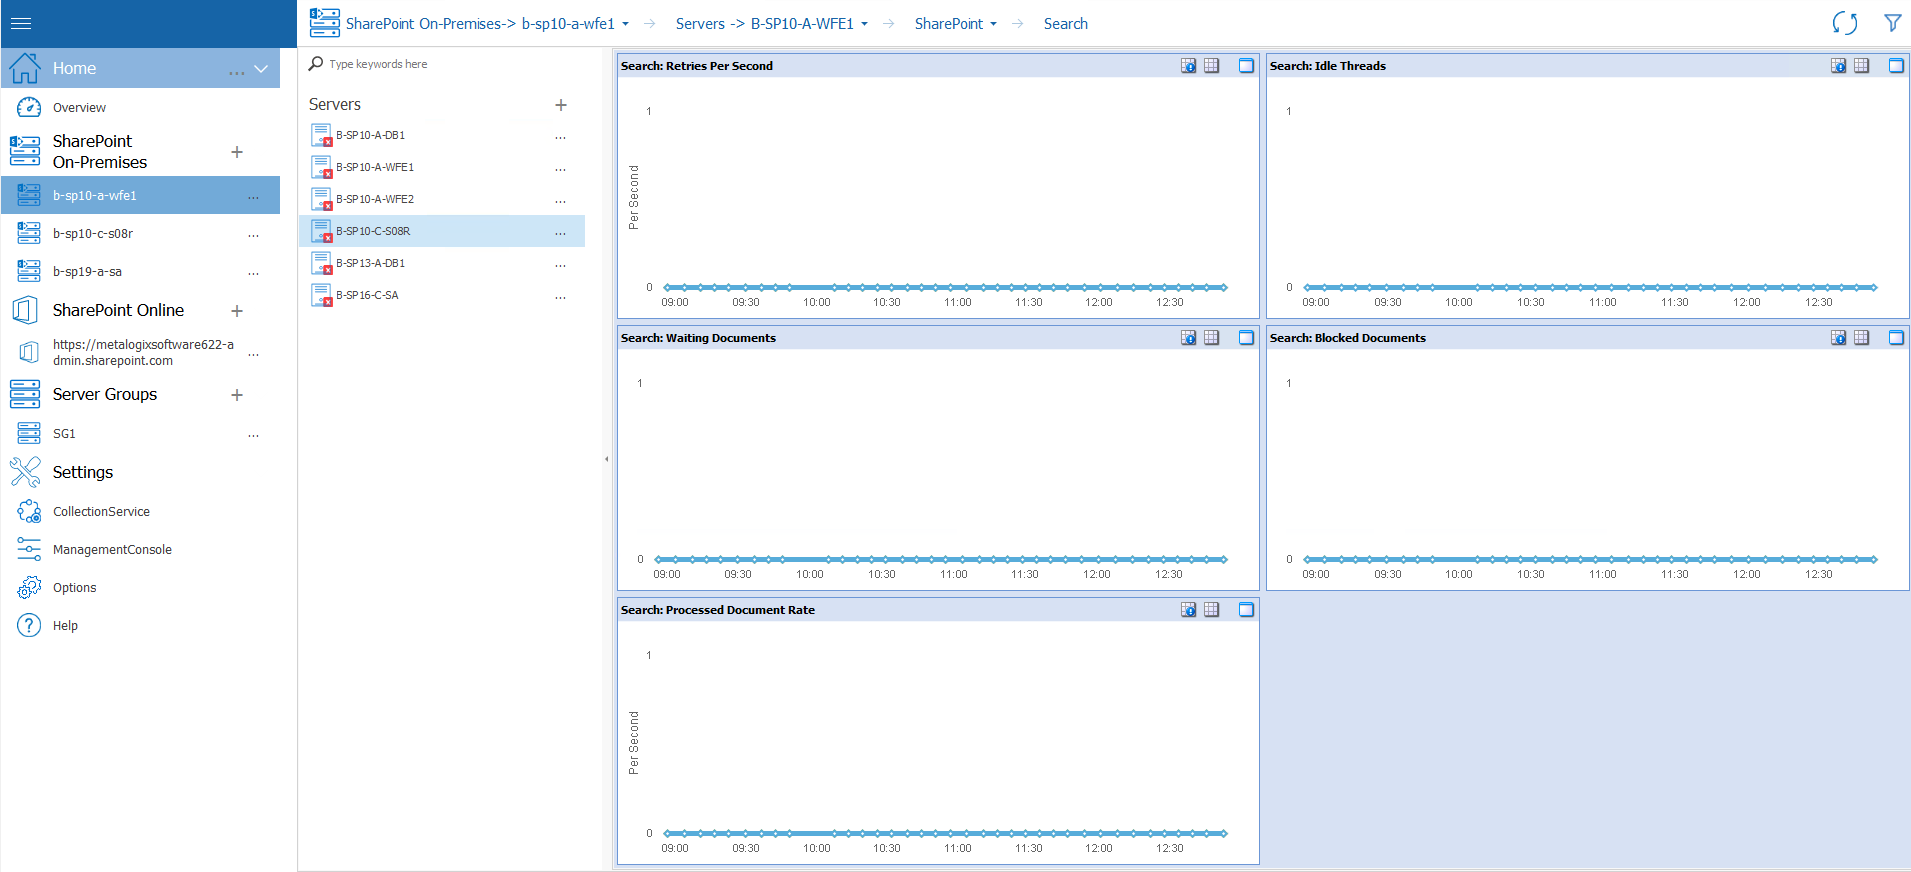
·Statistics about the Search (SharePoint search) on the selected server.
·Statistics about the Indexer (SharePoint indexing services) on the selected server
·Statistics about the Excel calculation on the selected server.
See also Working with Graphical Server Data.
·Information about SharePoint Services on the selected server, including a graphical representation of the Status of a selected timer job for a specified duration.
·A link to the ULS log entry viewer with entries for the selected server.
See also Viewing ULS Log Entries for a Farm.
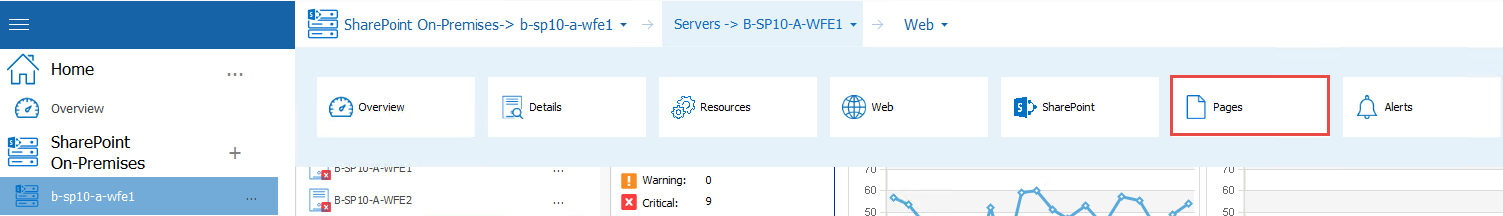
The Server - Pages view lets you review the status of the monitored pages on the selected server.
To access the Server Pages view:
1In the Management Console select the server whose monitored pages you want to view. Double click it so that the overview pane for it opens up.
2Select the server name above the overview pane. This will produce a drop down panel, select Pages.
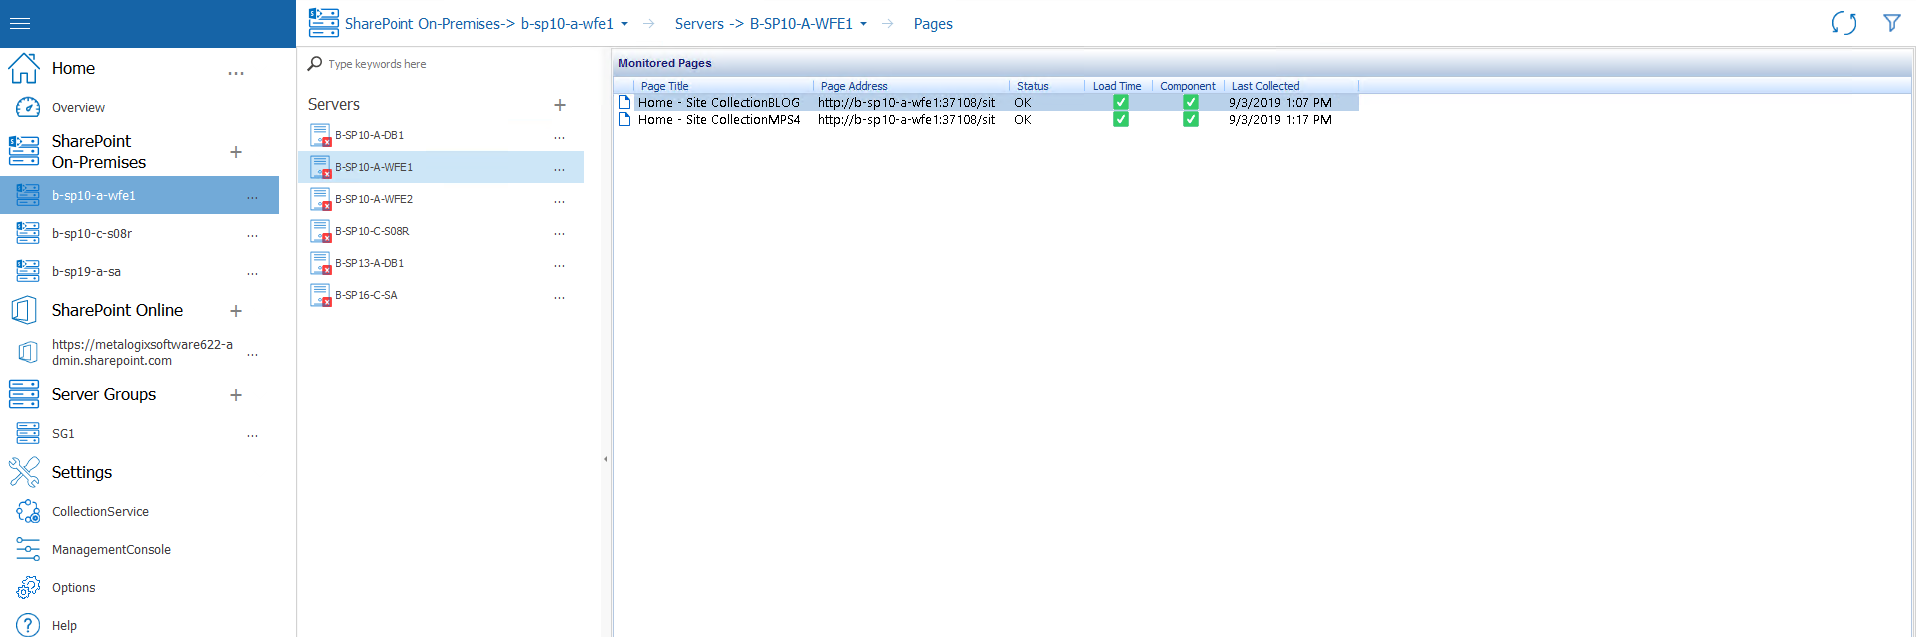
The Server Pages view includes the following information about each page on the selected server:
·the Page Title and Page Address
·the current Status of the page
·the alert status of the Load Time
·the alert status of the page Component.
·and the time when it was Last Collected.
To view Statistics for a monitored page:
Double-click the page whose statistics you want to view.
When data about servers includes a graphical component you can:
·change the time and duration of displayed data, and
·view more details
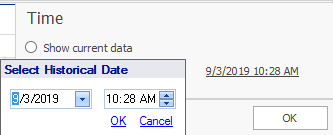
To view data from a specified date and time:
1While viewing server statistics, select the Filter button in the right hand corner. This will open the Time filtration options.
2In the Time tab, select Show data as of:
3Click the date and time hyperlink. In the Select Historical Date dialog, select the date and time to show data from, then click OK, and OK once more.
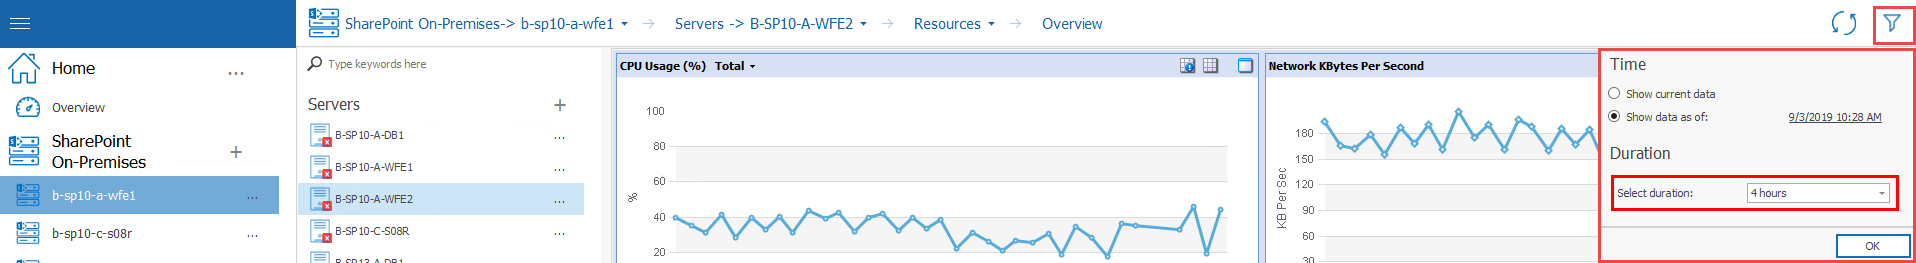
To change the duration represented in the graph:
When looking at the Resources Overview, you can also filter for duration.
To do so select a value from the Select duration drop-down, accessed through the Time Filter.
Select a duration from the Select duration drop-down list.
If you want to view more detail about a single graph, click one or more of the icons in the graph's top right corner:
·Show legend (
·Show tabular data (
·Maximize graph (