| Field | Description |
|---|---|
| Connection name |
Enter the preferred display name for the Windows machine. Note: If left blank, the Connection name field resets to the value of the Address field. |
| Local Machine |
Select to diagnose the machine you are now using. |
| Address |
Enter the hostname, IP address or URL to the Windows machine. Note: The value changes to "." and cannot be edited when Local Machine is selected. |
Logon Details
Note: Not applicable when Local Machine is selected.
| Field | Description |
|---|---|
| Domain |
The name of the domain the user belongs to (to login to the Windows machine). Note: If you intend to leave User blank then Domain should also be left blank. |
| User |
Enter the user name to login to the Windows machine. |
| Password |
Enter the password to login to the Windows machine. Note: Applicable when Save password details (for this connection) is selected. |
Select Save password details (for this connection) to save the password.
Note: Not applicable when Local Machine is selected.
Close the dialog.
| Click | Description |
|---|---|
| Connect | Save changes and open the connection in Spotlight. |
| OK | Save changes. Do not open the connection in Spotlight. |
| Cancel | Do not save changes. |
Troubleshooting Spotlight on Windows
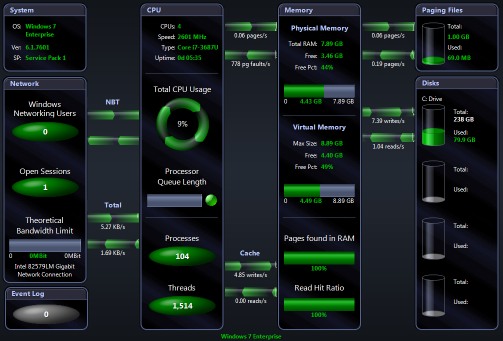
The Spotlight home page shows the flow of information and commands between various sub-components and the size and status of internal resources such as processes, disk files and memory structures.
The display is based on the Windows architecture diagram. Windows Architecture Overview
Related operating system statistics are grouped together on panels that are connected by a series of graphical flows and icons. Spotlight updates these flows in real time so you can see how quickly data is moving through the system. The icons change color as Spotlight alarms are raised, upgraded, downgraded and canceled.
Tip: Hover the mouse pointer over a panel component for more information.
To see the Spotlight on Windows Home Page
 .
. 
Spotlight alerts you to problems with your system by issuing an alarm.
| This alarm… | Alerts you… |
|---|---|
| Cache alarms | When the level of cache activity exceeds a threshold. |
| Disk alarms | As the logical disk is filling up, and also when disk activity exceeds a threshold. |
| Event Log Alarm | When an Event Log entry is found which matches an active Event Log severity rule. |
| Memory alarms | When the available memory (both physical and virtual) drops below specified thresholds. |
| Paging alarms | When there is excessive paging activity on the target system. |
| Process alarms | When processes sustain a high CPU load. |
| Windows CPU Alarm | When the server’s CPU usage exceeds a specified percentage. |
| Windows Status Alarms | Spotlight is re-establishing its connection to the Windows system. |
Once a problem is isolated you can display a drilldown page with charts and tables that provide a detailed breakdown of the underlying statistics.
| Drilldown | Click to open | Keyboard Shortcut | Drilldown Pages | Description |
|---|---|---|---|---|
| Processes |  |
CTRL+P |
The Processes drilldown lists all processes and services currently running on the Windows system. You can view detailed information about each process. | |
| CPUs |  |
CTRL+C | CPUs Page | Processing Page | Multiprocessor Page |
The CPU tab displays details of recent processor activity as measured by Windows. |
| Memory |  |
CTRL+M | Summary Page | Paging Activity Page | Cache Page |
The Memory drilldown displays detailed information about recent physical and virtual memory usage. |
| Disks |  |
CTRL+D | Logical Disk Activity Page | Physical Disk Activity Page | Logical Disk Space Usage Page | Disk Summary Page | File Sizes Page |
The Disks drilldown displays detailed information about the logical and physical disks on the Windows system. |
| Network |  |
CTRL+N | Network Page | TCPIP Page | NBT Page | SPX Page | Sessions Page | Shares Page | Open Ports Page | cLAN Gigabit Page |
The Network drilldown displays detailed information about the network activity to and from the Windows system. |
| Activity Summary |  |
CTRL+A | Activity Summary Page |
The Activity Summary drilldown displays summaries of recent Windows activity including, paging and packet rates, CPU usage across all processors, the number of threads waiting to be run, and the number of I/O requests that were queued for each logical disk. |
| Event Log |  |
CTRL+E | Event Log Page |
The Event Log drilldown shows recent event log items that have occurred on the Windows system. |
| Single Application |  |
CTRL+S | Summary Page | CPUs Page | Memory Page | Disks Page |
The Single Application drilldown displays detailed information about specified individual processes (or a group of processes) on a Windows system. Choose the processes you want Spotlight to analyze from View | Options | Data collection | Windows applications metrics. |
| Alarm Log |  |
CTRL+L |
The Alarm Log drilldown displays information on the alarms associated with the Windows system, including the name of the component that issued the alarm, the date and time the alarm was logged, and the severity of the alarm. Note: The Alarm Log drilldown is common to all Spotlight applications. The alarms are specific to the current Spotlight connection. Spotlight on Windows Alarms |
