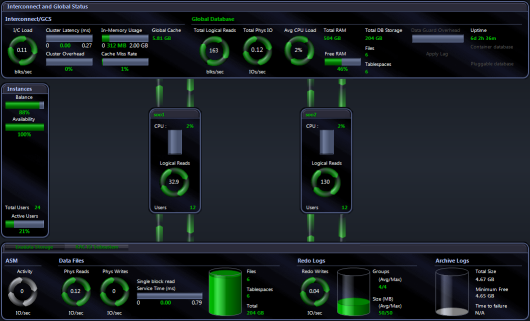
The Spotlight home page shows an overview of the activity in an Oracle RAC database cluster.
The display is based on the Oracle RAC architecture diagram. Oracle RAC Architecture Overview
Related operating system statistics are grouped together on panels that are connected by a series of graphical flows and icons. Spotlight updates these flows in real time so you can see how quickly data is moving through the system. The icons change color as Spotlight alarms are raised, upgraded, downgraded and canceled.
Tip: Hover the mouse pointer over a panel component for more information.
To see the Spotlight on Oracle RAC Home Page
 .
. 
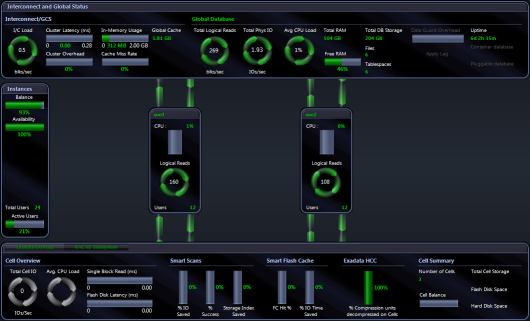
Where an Oracle Exadata System is installed and licensed the Spotlight on Oracle RAC Home Page looks slightly different. An additional Exadata Storage Panel monitors the Exadata Storage System (Cells).
Spotlight alarms indicate when the Oracle RAC exceeds acceptable performance thresholds.
Problems in a single instance may not always affect the operation of the cluster as a whole. In such cases, Spotlight on Oracle RAC can display an alarm in the relevant instance panel without reporting a specific Spotlight on Oracle RAC alarm.
However, if a problem in a single instance DOES affect the operation of the whole cluster – or is repeated in multiple instances so that the combined effect is significant – Spotlight on Oracle RAC reports the problem as an aggregated alarm.
These alarms are displayed on the Spotlight on Oracle RAC home page – usually in the Global Database heading of the Interconnect and Global Status panel, or on the individual components of the IO Subsystem panel.
Notes:
Following are the alarms specific to Spotlight on Oracle RAC.
| Alarm | Description |
|---|---|
| An Archive Critical Failure alarm indicates that the number of working archive destinations for the database cluster is about to fall below the minimum number needed to archive Oracle redo logs successfully. When you see this alarm, you should make space in the archive log destination by purging – or by backing up to an offline medium – any archived files that are not immediately needed. | |
| Spotlight raises an Archive Destination Failed alarm when at least one of the archive destinations specified for redo log files has become full. See Archive Destination Failure alarm below. | |
| An Archive Destination Failure alarm when at least one of the archive destinations specified for redo log files is about to become full. When you see this alarm, you should make space in the archive log destination by purging it, or by backing it up to an offline medium. | |
| When a Spotlight connection is lost, Spotlight automatically tries to re-establish the connection. The ASM Status alarm indicates that Spotlight is re-establishing its connection to the ASM diskgroup for the Oracle RAC cluster. | |
| This alarm indicates that the instances participating in the cluster are NOT all currently available for access. The database administrator should determine why the instances are unavailable, and restart them after taking the required actions. | |
| See Miss Rate alarm below. | |
| Spotlight raises the Cluster Latency alarm when cluster latency from all causes (interconnect, GES, LMS overhead) exceeds a specified threshold. Cluster latency is defined as the average elapsed time from when a requesting instance requests a block of data to the time when the requesting instance receives the block. | |
|
Spotlight raises the Cluster Overhead alarm when the percentage of time dedicated to cluster co-ordination activities exceeds a specified threshold. Cluster overhead is the amount of time spent waiting for cluster related activities as a percentage of the total time spent waiting for all activities. | |
|
Spotlight raises separate alarms for corrupt and lost blocks when a specified percentage of the blocks transferred across the interconnect are corrupted or lost during global cache consistent read requests. High levels of lost or corrupt blocks should not happen in normal circumstances. If these alarms fire at all, it indicates either very serious overloading of the Oracle RAC cluster, or software or hardware faults in the cluster. | |
| Spotlight raises an Instance Failed alarm when a specified instance has failed because of an Archiver error. See Archive Critical Failure alarm above. | |
|
Spotlight raises the Load Imbalance alarm when:
Cluster balance is a fundamental indication of the health and productivity of an Oracle RAC environment. If load is not reasonably evenly distributed across the instances in a cluster, then the DBA is likely to regret having chosen a clustered environment. Spotlight on Oracle RAC calculates balance by recording a user-definable metric of load over time on each instance (the default is Logical Reads, but you can switch this to CPU usage or Physical Writes via the Spotlight on Oracle RAC Options window) and calculating the relative balance of load across the cluster. In the normal course of events, there are always minor variations in load between instances within the cluster, so Spotlight uses a statistical technique to determine if a variation is significant. Note: The activation of specific Oracle Services can unbalance the workload across the Oracle RAC cluster. In these cases, Spotlight triggers the Load Imbalance alarm only when a more significant threshold is reached. | |
|
This alarm, more specifically known as the Cache Miss Rate alarm or Global Cache Miss Rate alarm, is raised when the global cache local miss rate exceeds a specified threshold. This rate is the percentage of time that a block required for a logical read is located in an inconsistent mode on ANOTHER instance in the cluster and must be transferred. | |
|
Average Percentage CPU Load Across The Exadata Storage Cells |
The Average Percentage CPU Load Across The Exadata Storage Cells alarm occurs when the total CPU utilization of the Exadata Storage Servers exceeds a threshold. One or more of the Server CPU may encounter a large number of requests, or you may have un-tuned SQL, which uses excessive amounts of CPU. |
| The Maximum Percentage CPU Load on The Exadata Storage Cells alarm occurs when the CPU utilization of one or more Exadata Storage Servers (Cells) exceeds a threshold.. One or more of the Server CPU may encounter a large number of requests, or you may have un-tuned SQL, which uses excessive amounts of CPU. | |
| The Single Block Read alarm is raised if the average time taken to complete a request for a single block from the Exadata Storage Servers exceeds a given threshold. The source of the latency may be any database using the Exadata Storage Servers. | |
| The Cell Balance alarm is raised when there is an unequal distribution of work-load between the Exadata Storage Servers. | |
| Spotlight has lost its connection to at least one Exadata Storage Server, and is unable to re-connect. Check the status of your network connection. Check the status of the hosts of each Exadata Storage Server. | |
| This alarm indicates that Spotlight has lost its connection to the Oracle RAC cluster, and cannot re-connect to any of the nodes in the cluster. Check the status of your network connection, your host machines, and your database instances. |
Note: Spotlight on Oracle Data Guard alarms occur in the Alarm Log of the Primary Database in the Oracle Data Guard environment. See Spotlight on Oracle Data Guard Alarms for more information.
Once a problem is isolated you can display a drilldown page with charts and tables that provide a detailed breakdown of the underlying statistics.
| Drilldown | Click to open | Keyboard Shortcut | Drilldown Pages | Description |
|---|---|---|---|---|
| Top Sessions |  |
CTRL+S |
Top Sessions lists all users connected to the Oracle database. As per Spotlight on Oracle. | |
| SQL & Application Workload |  |
CTRL+Q | Top SQL Page | Array Fetch Page | Parse Activity Page | Sort Activity Page |
As per Spotlight on Oracle. The SQL & Application Workload drilldown in Spotlight on Oracle RAC does NOT contain the following pages:
|
| Activity |  |
CTRL+Y | Summary Page | Waits Page | Waiting Events Page | Blocking Locks Page | Latches Page | Transactions Page | Buffer Busy Waits Page |
As per Spotlight on Oracle. The Activity drilldown in Spotlight on Oracle RAC does NOT contain the following pages:
|
| I/O |  |
CTRL+I | Summary Page | Sessions Page | Tablespaces Page | Datafiles Page | Segment Page | Buffer Pool Page | Chains / Migrations Page |
As per Spotlight on Oracle. |
| Configuration & Memory |  |
CTRL+N | SGA Utilization Page | In-Memory Page | Oracle Parameters Page | Alert Log Page |
As per Spotlight on Oracle. The Configuration & Memory drilldown in Spotlight on Oracle RAC does NOT contain the following pages:
|
| Disk Storage |  |
CTRL+D | Archive Destinations Page | Tablespace Utilization Page |
The Disks drilldown displays detailed information about the logical and physical disks. As per Spotlight on Oracle. The Disk Storage drilldown in Spotlight on Oracle RAC does NOT contain the following pages:
|
| Cluster |  |
CTRL+U |
Latency Page | Balance Page | Miss Ratio Page | Corrupt/Lost Blocks Page |
The pages in the Cluster drilldown display information about the performance of the Oracle RAC cluster, including details on cluster latency, balance, overhead, miss ratios, and corrupt or lost blocks. |
| ASM |  |
CTRL+M | Diskgroups Page | Disks Page | Files Page | Storage Page | Operation Page |
Diagnose the performance of Automatic Storage Management (ASM) for the Oracle RAC cluster. As per Spotlight on Oracle. |
| Services |  |
CTRL+E | Services By Instance | Resources Page | Activity Page | Waits Page | Configuration Page |
The Services drilldown displays details of the services defined and deployed for the Oracle RAC cluster. Note: Available for Oracle 10.2 and later. |
| Predictive Diagnostics |  |
CTRL+G | Predictive Diagnostics |
Collect and analyze performance metrics in order to predict the future behavior of the Oracle database. |
| Pluggable Databases |  |
CTRL+P | Resource Usage |
(Oracle 12c) View resource usage of pluggable databases. |
| Data Guard |  |
CTRL+W | Standby Connections Dialog |
Use to configure Spotlight to monitor Standby databases to this Primary database in an Oracle Data Guard environment. Note: The Data Guard icon is enabled when the current Spotlight on Oracle RAC connection is configured as a Primary database in an Oracle Data Guard environment. |
| Exadata |  |
CTRL+T |
Exadata Databases | Exadata ASM Groups | Exadata Cell Disks |Exadata Smart Flash Cache | Exadata Cell Balance | Exadata Cell Metrics |
Detect and help resolve performance issues on Oracle's Exadata machine. Note: Spotlight on Oracle RAC may include monitoring of Exadata systems depending on the license purchased. When licensed, the Exadata icon is enabled on connection to an Oracle Exadata system. |
| Alarm Log |  |
CTRL+L |
The Alarm Log drilldown displays information on the alarms associated with the Windows system, including the name of the component that issued the alarm, the date and time the alarm was logged, and the severity of the alarm. Note: The Alarm Log drilldown is common to all Spotlight applications. The alarms are specific to the current Spotlight connection. For more information, see Spotlight on Oracle RAC Alarms. |
Use Spotlight on Unix to monitor Unix and Linux operating systems, detect and resolve problems.
|
Section |
Description |
|---|---|
| Connect to Unix Systems | Create / Modify / Delete connections to Unix systems. |
| Spotlight on Unix Home Page | The Spotlight home page shows the flow of information and commands between various sub-components and the size and status of internal resources such as processes, disk files and memory structures. |
| Spotlight on Unix Alarms |
Spotlight alerts you to problems with your system by issuing an alarm. You can configure Spotlight in the level of severity that constitutes an alarm, to disable an alarm, and the actions Spotlight takes on raising the alarm. |
| Spotlight on Unix Drilldowns | When you have isolated a problem, you can display a drilldown page, whose charts and tables provide a detailed breakdown of the underlying statistics. |
