Introducing Foglight APM
Monitoring Transactions
Investigating real user APM transactions
Investigating application server transactions
Configuring display options
Examining Response Times
Investigating response time breakdowns
Configuring Response Time Breakdown settings
Additional configuration options
Examining Error Breakdowns
Viewing Real User Activity from a Geographical Perspective
Using the SOC Transactions Tab
Exploring the SOC Transactions tab
Exploring response time breakdowns from the SOC
Configuring display options
Using the SOC for APM triage
Creating Custom Drag-and-Drop Dashboards
APM Tile and View Reference
Overview of APM tiles
Application Servers - .NET tile
Application Servers - Java tile
DB2 tile
Host tile
JMX tile
MQ tile
Oracle tile
OS tiles
Pivot tiles
Real User (APM) tile
Real User (FxM) tile
Sequence tile
SQL Server tile
Sybase tile
Synthetics tile
Virtual Hyper-V tile
VMware tile
Overview of Detail views
Application Server detail view
Host detail view
Pivot Breakdown detail view
Real User (APM) Performance detail view
Appendix: Enabling End User Transactions from FxM and FxV
Hits and Pages tabs
Response Time Breakdown tab
Application Infrastructure tab
Related Infrastructure tab
Real User (FxM) Performance detail view
Synthetic Result detail view
Synthetic User Performance detail view
Virtual Machine detail view
Topology object name reference table
Mapping datasources
By default, datasources appear on the Response Time Breakdown tab with limited information. If you know the proper type of a datasource (for example, if it is an Oracle® database), you can map the datasource to a specific application component. A correct mapping provides access to drill down information, such as host or database metrics.
|
1 |
|
2 |
Click the Response Time Breakdown tab. |
Figure 13. Example - icon of an unmapped datasource
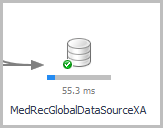
Figure 14. Example of a detail view
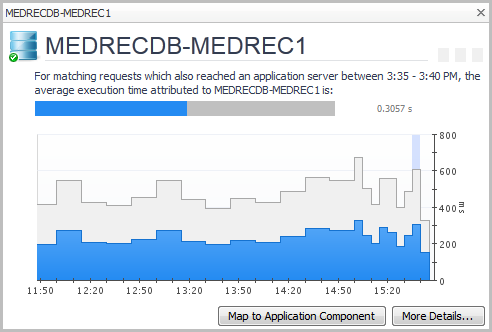
|
4 |
Click Map to Application Component. |
Figure 15. Assign Resolver Wizard
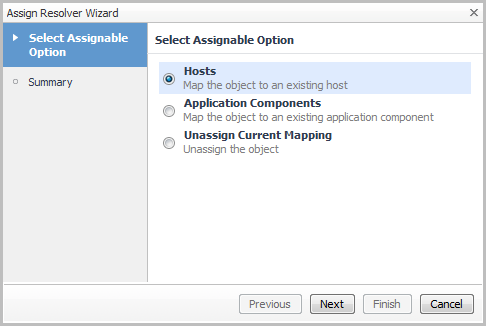
|
1 |
|
3 |
Click Finish. |
|
1 |
For example, to map a datasource to an Oracle® database instance, select DBO_Instance.
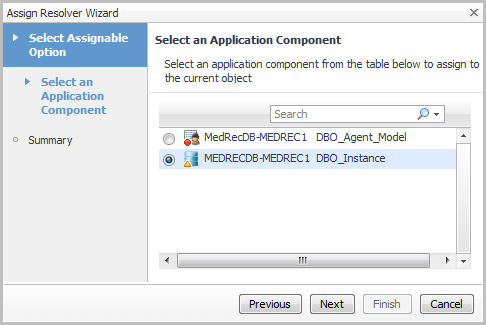
|
3 |
Click Next. |
|
4 |
Click Finish. |
|
1 |
Select Unassign Current Mapping. |
|
2 |
Click Next. |
|
3 |
Click Finish. |
The mapping for the object is removed. To assign a different mapping, click Map to Application Component and select a new mapping.
Examining Error Breakdowns
For an overview of how to use this dashboard, see Investigating error breakdowns.
For more information, see Configuring Response Time Breakdown settings.
Investigating error breakdowns
|
• |
On the navigation panel, under Dashboards, click APM > Error Explorer. |
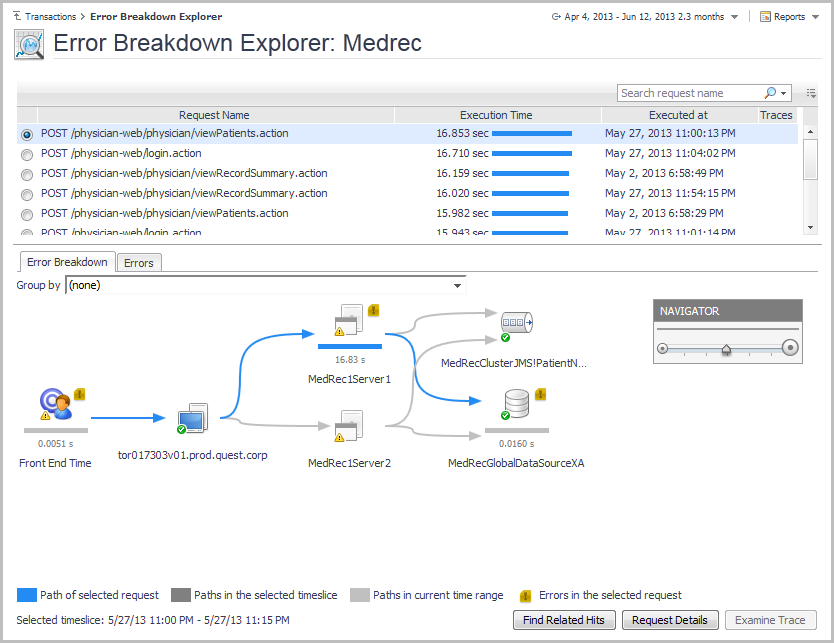
The Error Breakdown Explorer dashboard opens.
Figure 17. Error Breakdown Explorer dashboard
|
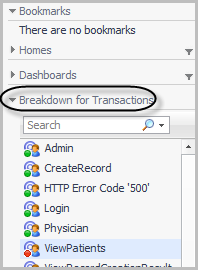
• |
Open the navigation panel and select a transaction from the Breakdown for Transactions list. |
For more information, see the following topics:
Requests with errors in the selected timeslice
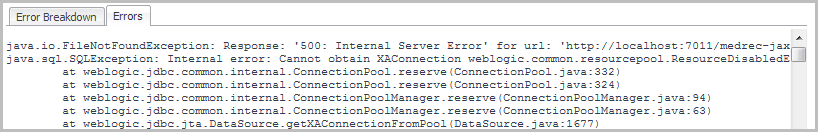
On the Errors tab, you can see what the error was. For example:
Figure 19. Errors tab