
Investigating real user APM transactions
The Transactions dashboard enables you to visualize end user data without the need to create services in Foglight. Use this dashboard to quickly identify if any transactions are having issues, to determine the magnitude of impact on the user population, and to view preliminary information that can aid in troubleshooting, including geographic discrepancies and whether the performance problems are in the back-end architecture, or the client-side browser or network.
|
1 |
On the navigation panel, under Dashboards, click APM > Transactions. |
|
2 |
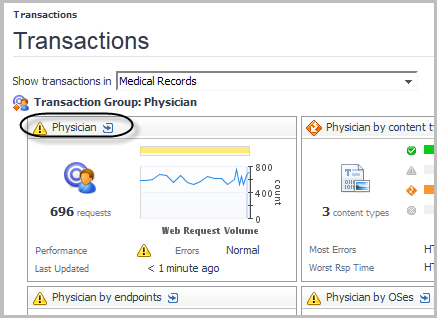
Click the down arrow in the Show transactions in box and select the transaction group you want to view from the list. |
|
3 |
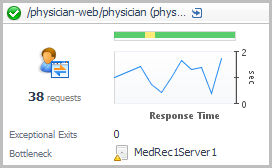
Locate a transaction group that is experiencing errors. For example, users in the Physician transaction group are experiencing poor performance. The health status icon indicates Warning status |
|
4 |
|
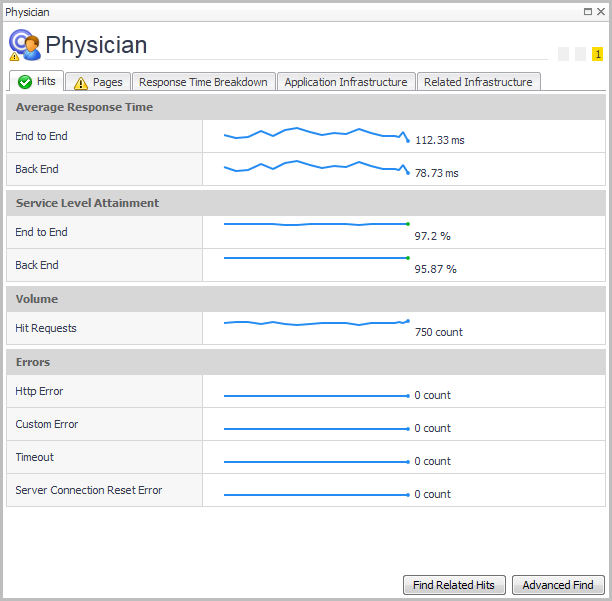
TIP: The detail view, and the tabs available, depend on the type of transaction selected. For example, drilling down on a Real User (APM) tile opens a performance detail view (as shown), while drilling down on a pivot result opens a summary view with tiles for each type of pivot you have defined (see Pivot Breakdown detail view for details). |
|
5 |
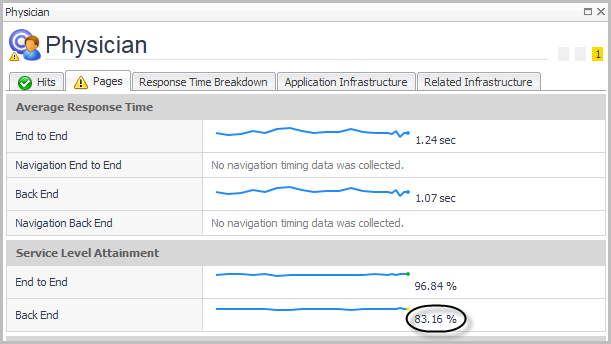
Click the Pages tab. Here you can see that the Warning status has been triggered by the Service Level Attainment for Back End dropping below an acceptable threshold. |
|
6 |
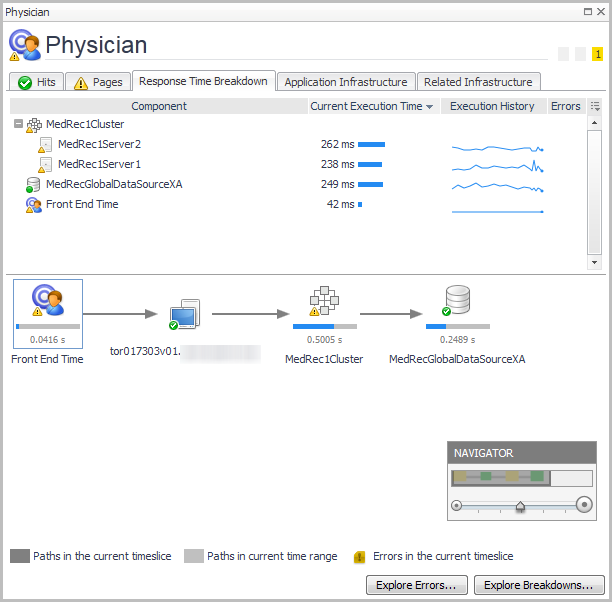
Click Find Related Hits to investigate further. |
|
7 |
|
• |
The dark grey arrows (Paths in the current timeslice) indicate the path taken by at least one request in the current timeslice (for example, between 3:20 and 3:25pm). |
|
• |
The light grey arrows (Paths in selected time range) indicate the path taken by at least one request in the time range selected with the zonar (for example, the last four hours). |
|
• |
Click Explore Breakdowns to open the Response Time Breakdown Explorer. For more information, see Examining Response Times. |
|
• |
Click Explore Errors to open the Error Breakdown Explorer. For more information, see Examining Error Breakdowns. |
For more information about the tiles, detail views, and metrics, see APM Tile and View Reference.
Investigating application server transactions
The Transactions dashboard allows you to visualize application-specific transaction data (that is, Java™ EE or .NET® transactions) with or without end user data. Use this dashboard to quickly identify if any transactions are having issues, and to view preliminary information that can aid in troubleshooting, including geographic discrepancies and whether the performance problems are in the back-end architecture, or the client-side browser or network.
In order to populate the Transactions dashboard or the SOC Transactions tab with data from Foglight for Java EE Technologies or Foglight for Microsoft .NET (version 5.9.1 or later), ensure that you used the appropriate procedures in Configuring request breakdowns.
|
1 |
On the navigation panel, under Dashboards, click APM > Transactions. |
|
2 |
Click the down arrow in the Show transactions in box and select the transaction group you want to view from the list. |
|
4 |
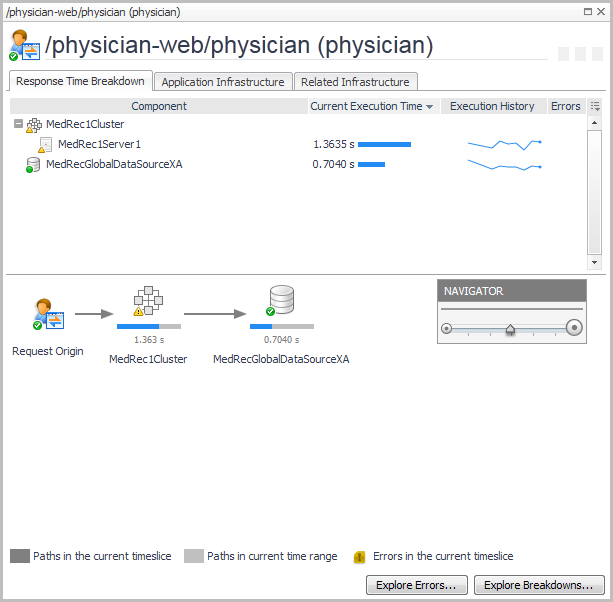
Click the name of the transaction (/physician-web/physician (phys...)) in the title bar of the tile to drill down for more information. |
|
• |
The dark grey arrows (Paths in the current timeslice) indicate the path taken by at least one request in the current timeslice (that is, the most recent sample period reported by the agent). |
|
• |
The light grey arrows (Paths in current time range) indicate the path taken by at least one request in the time range selected with the zonar (for example, the last four hours). |
|
• |
Click Explore Breakdowns to open the Response Time Breakdown Explorer. For more information, see Examining Response Times. |
|
• |
Click Explore Errors to open the Error Breakdown Explorer. For more information, see Examining Error Breakdowns. |
|
• |
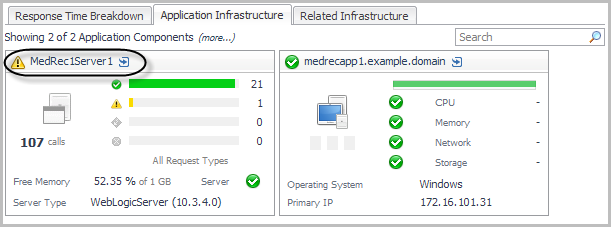
Click the Application Infrastructure tab to investigate the application components. This tab displays a tile for each component. In this example, there is a host (medrecapp1.example.domain) and an application server (MedRec1Server1). |
For more information about the tiles, detail views, and metrics, see APM Tile and View Reference.
Configuring display options
You can customize the layout of the Transactions dashboard by selecting the appropriate options in the Tile Display Options dialog box. Use these options to control the total number of tiles, the order in which they appear, and the rollup options for multiple FTR locations (if applicable).
|
1 |
With the APM > Transactions dashboard open in the display area, open the action panel on the right side of the browser interface. |
|
2 |
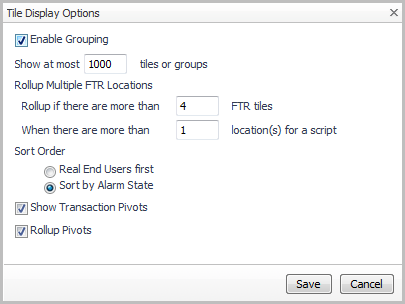
Click Tile Display Options. |
|
• |
The Enable Grouping option groups user tiles together by transaction name. By default, groups are sorted by their severity first, then by their name. This grouping is not affected by the Sort Order options. |
|
• |
The Show at most n tiles or groups setting determines the total number of tiles displayed. Synthetic transaction locations are first rolled up using the rollup criteria below. After that, the total number of tiles is determined by the maximum number of tiles that you specify. |
|
• |
the maximum number of single-location Synthetics tiles, using the Rollup if there are more than n FTR tiles setting, and then |
|
• |
the maximum number of locations per script, using the When there are more than n location(s) for a script setting. |
|
• |
Use the Sort Order options to sort the tiles by either type (Real End Users first) or alarm severity (Sort by Alarm State). |
|
• |
For example, you can configure the Transactions tab to display a maximum of ten tiles sorted by the alarm state (highest severity first). |
|
• |
The Show Transaction Pivots option controls whether transaction pivots are displayed. If you do not want to see Pivot tiles, clear this check box. |
|
• |
The Rollup Pivots option controls whether pivot data are grouped together or rendered individually. For example, Foglight can roll up all pivots such as Chrome™, Firefox®, Internet Explorer®, and Opera™ into a single web browsers pivot tile. |
|
4 |
Click Save. |
Examining Response Times
For an overview of how to use this dashboard, see Investigating response time breakdowns.