Advanced settings
Setting maximum display of characters for single trace parameters values
|
CAUTION: The higher the MaxTraceValueSize value, the more information saved to the database, and the higher the impact on performance overhead. |
The default setting is: MaxTraceValueSize = 128.
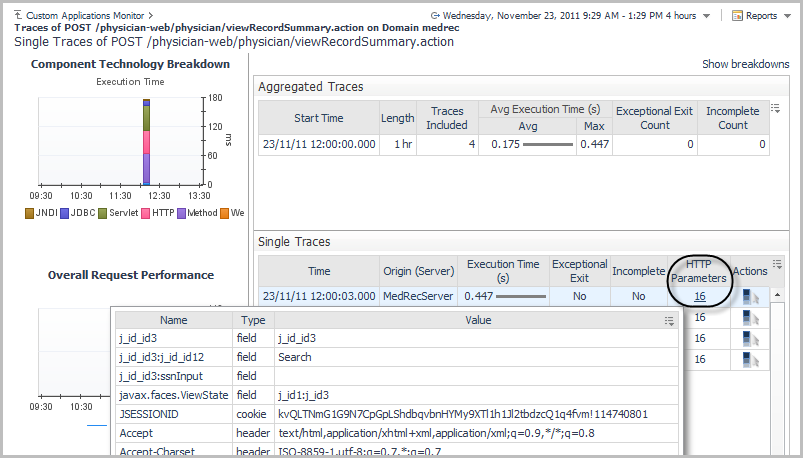
To collect single trace parameter details, enable the Collect All Parameters option in the Application Servers Monitor > Requests view > Action column > Collect Traces dialog box.
For more information, see the Monitoring Requests section in the Foglight for Application Servers User Guide.
Setting memory usage for object tracking
|
CAUTION: The higher the LiveObjectLifespanLimit value, the more memory used and the higher the impact on performance overhead. |
In addition to the LiveObjectLifespanLimit, you can also limit the number of live objects that agents can track. Increasing this value allows the agent to track more live objects concurrently, but uses more memory in the application server process. Decreasing this value makes it more likely that the agent will expire the live object before it is collected, but uses less memory.
Configuring APM URL transformation
|
1 |
On the navigation panel, under Dashboards, click Application Servers > Administration. |
|
3 |
On the Nexuses view, click the Recording Settings tab. |
|
4 |
In the Recording Settings view, click APM URL transformation. |
|
5 |
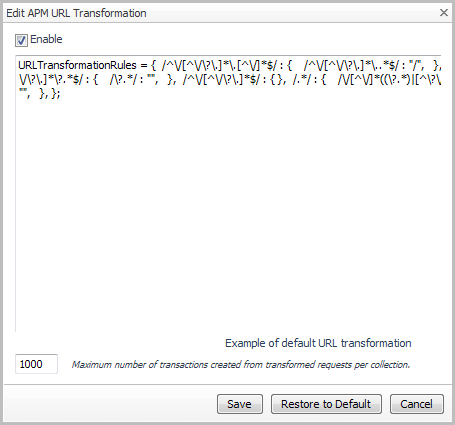
If you do not want Java or .NET data to appear in the APM dashboards, clear the Enable check box and click Save. |
|
6 |
|
TIP: If you are uncertain about how to configure these rules, click Example of default URL transformation to open a default example. |
|
7 |
Adjust the number of transactions created from transformed requests for each collection by typing a value in the Maximum number of transactions created from transformed requests per collection box. |
|
8 |
Click Save. |


