지금 지원 담당자와 채팅
지원 담당자와 채팅

Foglight for Hyper-V 6.3.0 - User Guide

About Hyper-V Monitoring in Foglight Evolve Cloud Agent administration Performance investigation with the Hyper-V Explorer Hyper-V Monitoring in Foglight Evolve Cloud alarms Appendix: Hyper-V Agent error codes

Accessing the Hyper-V Explorer

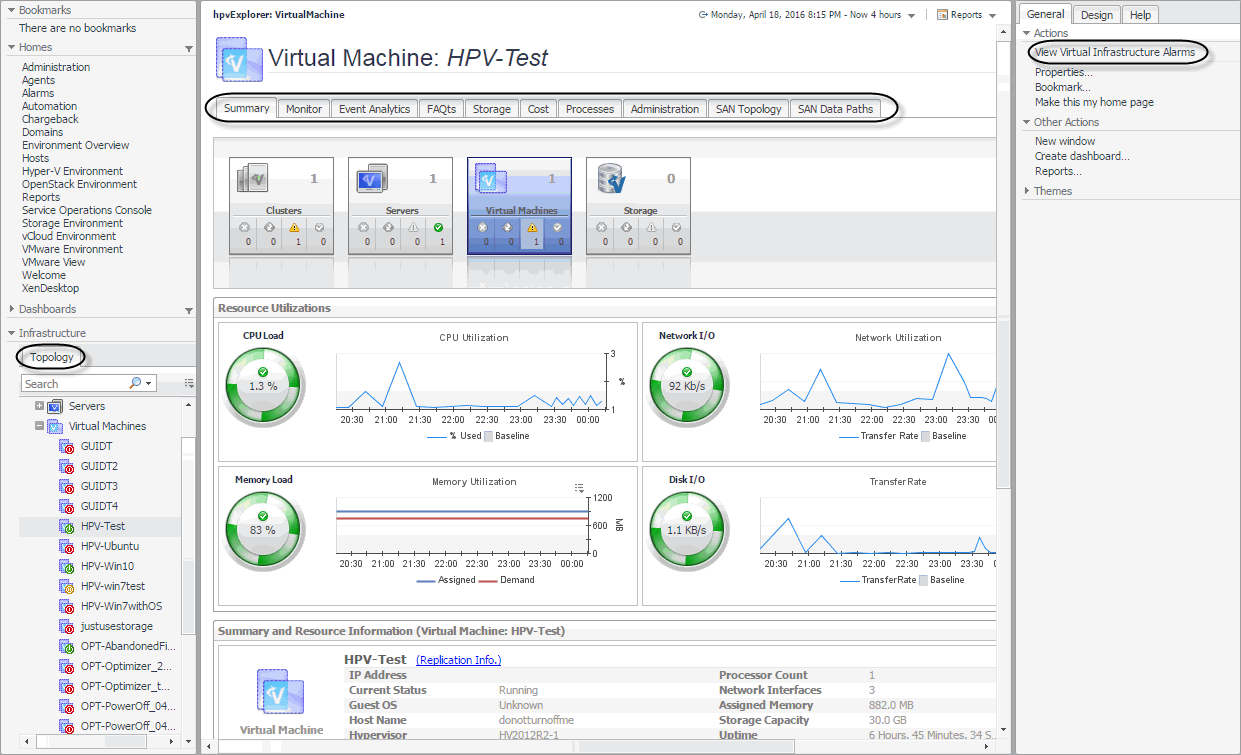
The Hyper-V Explorer provides detailed performance metrics about an object or a group of objects selected on the Hyper-V Explorer Topology tab.

Figure 13. Hyper-V Explorer

3
On the navigation panel, under Dashboards, click Hyper-V > Hyper-V Explorer.
Figure 14. Hyper-V Explorer

About the Hyper-V Explorer topology

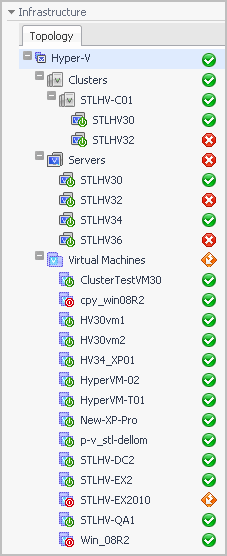
The Topology tab appears on the navigation panel when you access the Hyper-V Explorer. It displays a tree showing a hierarchical structure of the elements in your virtual infrastructure.

Figure 15. Topology tab

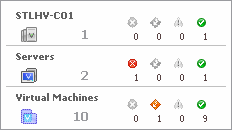
Use it to quickly select an object or object container and view the related information in the display area. Hovering over a specific node in this tree shows a dwell that gives you more information about that component, the related elements, and their alarm status. For example, hovering over a cluster node shows the name, the number of servers in that cluster, and the number of virtual machines running on the servers that belong to that cluster. It also shows the alarm counts for each component type and alarm severity.

Hyper-V Explorer Topology tab

The Hyper-V Explorer Topology tab contains an organized view of the virtual infrastructure objects that are monitored by Hyper-V Monitoring in Foglight Evolve Cloud: clusters, servers, and virtual machines.

This tab appears on the navigation panel, under Infrastructure.

Figure 17. Topology tab

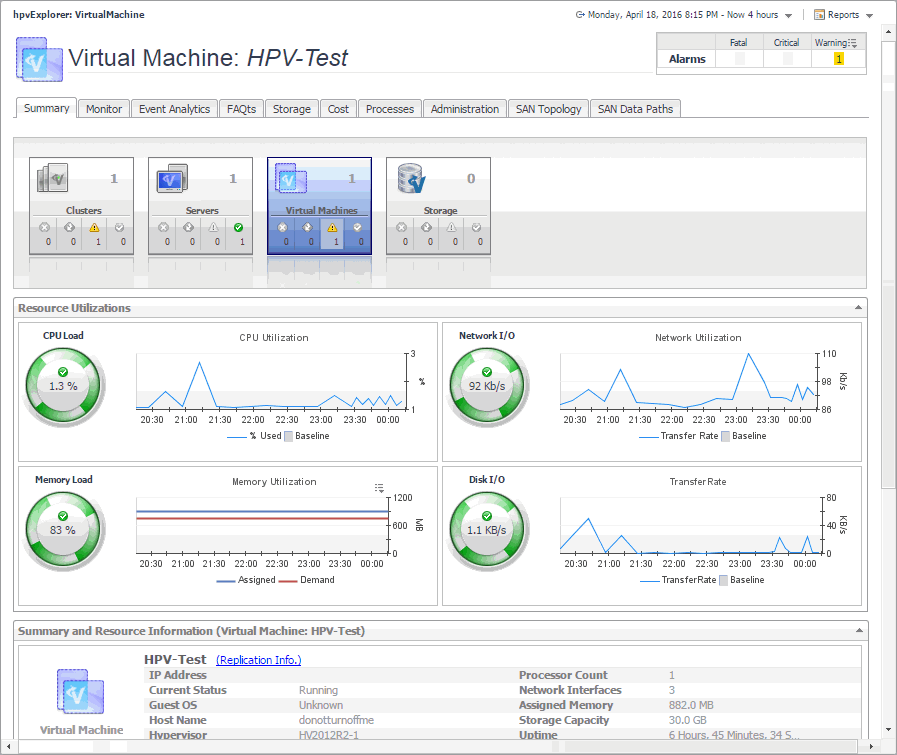
Hyper-V Explorer Summary

This is the first tab that appears open by default when you access the Hyper-V Explorer. It displays high-level information about the resource utilization and the selected component’s resources, such as its operating system, physical host, storage capacity, and others. The appearance of this tab depends on the object or group of object selected. For example, exploring a group of clusters shows a combined CPU consumption chart followed by a list of clusters, while exploring a virtual machine displays detailed resource consumption for the selected virtual machine.

관련 문서

The document was helpful.

평가 결과 선택

I easily found the information I needed.

평가 결과 선택