지금 지원 담당자와 채팅
지원 담당자와 채팅

Foglight for vCloud Director 6.1.0 - User Guide

Getting Started Setting Up Monitoring Agents Investigating Resource Consumption Levels Investigating Object Dependencies Reference

Exploring the Use of Individual Organization, Organization vDC, or Provider vDC Resources

The following views display the amounts of system resource consumption for a selected organization, organization vDC, or provider vDC:

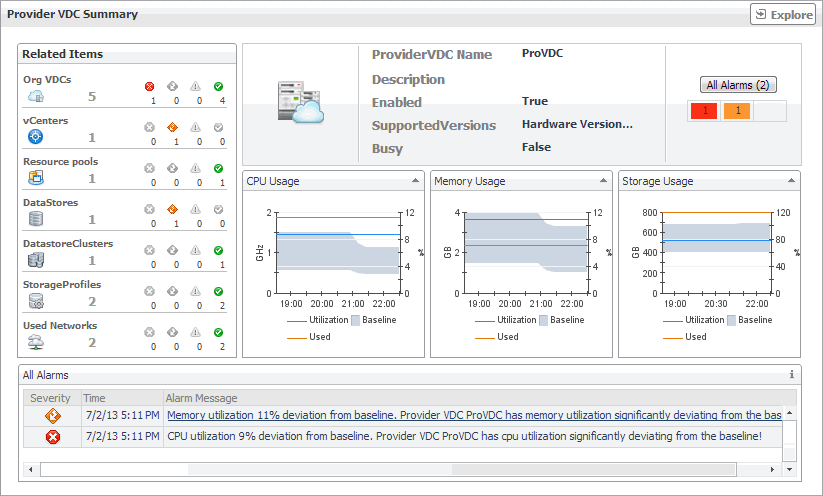
These views can help you find out the configuration properties of a selected object, such as its name and state, and to identify and prevent potential bottlenecks. They appear on the right in the Quick View when you select an organization, organization vDC, or provider vDC in the left pane.

The resource usage an configuration information appearing on this view is organized into the following views:

For information about the Related Items and All Alarms views also appearing in this summary, see the following :

Configuration Properties views

Use this view to find out the name and description of a selected organization, organization vDC, or provider vDC. The information appearing in this view also offers some basic configuration properties such as the object’s current state or allocation model (if applicable).

The combination of items in this view depends on the type of the selected object. For example, if you select an organization, this view displays its name, full name, description, and indicates if the view can publish or is enabled. Selecting a provider vDC shows its name, description supported versions, and indicates if the view is enabled or busy. If any alarms are generated against the selected object, the counts of alarms in each severity state are displayed.

CPU, Memory, and Storage Usage views

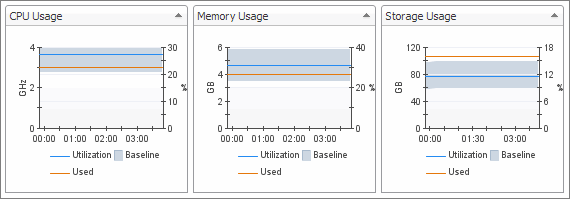
Use this view to find out the percentages of CPU, memory, or memory utilization the selected organization, organization vDC, or provider vDC spends over the selected time range.

For each of the identified organizations, organization vDCs, or provider vDCs, the graphs appearing on this tab display the following information. Foglight for VMware populates these tiles using the values stored as metrics collected from monitored organizations, organization vDCs, and provider vDCs.

The percentage of CPU resources an organization, organization vDC, or provider vDC spends during the selected time range.

VMVCloudOrganization cpuUtilization

VMVCloudOrganizationVDC cpuUtilization

VMVCloudProviderVDC cpuUtilization

The amount of CPU resources an organization, organization vDC, or provider vDC spends during the selected time range.

VMVCloudOrganization cpuUsed

VMVCloudOrganizationVDC cpuUsed

VMVCloudProviderVDC cpuUsed

The expected CPU usage range for an organization, organization vDC, or provider vDC. The data range is not based on the current metric values, but on calculations using historical data.

The percentage of memory resources an organization, organization vDC, or provider vDC spends during the selected time range.

VMVCloudOrganization memoryUtilization

VMVCloudOrganizationVDC memoryUtilization

VMVCloudProviderVDC memoryUtilization

The amount of memory resources an organization, organization vDC, or provider vDC spends during the selected time range.

VMVCloudOrganization memoryUsed

VMVCloudOrganizationVDC memoryUsed

VMVCloudProviderVDC memoryUsed

The expected memory usage range for an organization, organization vDC, or provider vDC. The data range is not based on the current metric values, but on calculations using historical data.

The percentage of disk space an organization, organization vDC, or provider vDC spends during the selected time range.

VMVCloudOrganization storageUtilization

VMVCloudOrganizationVDC storageUtilization

VMVCloudProviderVDC storageUtilization

The amount of disk space an organization, organization vDC, or provider vDC spends during the selected time range.

VMVCloudOrganization storageUsed

VMVCloudOrganizationVDC storageUsed

VMVCloudProviderVDC storageUsed

The expected disk usage range for an organization, organization vDC, or provider vDC. The data range is not based on the current metric values, but on calculations using historical data.

Monitoring vSphere Resources

A typical vSphere® infrastructure consists of the following objects:

Virtual centers: Software used to manage virtual environments that are built on the VMware virtualization platform. Each virtual center creates a hierarchical structure of virtual objects that enables a system administrator to logically lay out their virtual infrastructure configuration.
ESX® hosts: Physical machines hosting one or more virtual machines.
Resource pools: Mechanisms that enable the administrator to fine-tune resource allocations within a server cluster.
Datastores: Storage location for virtual machine files.
Datastore clusters: Collections of servers that share common storage resources.

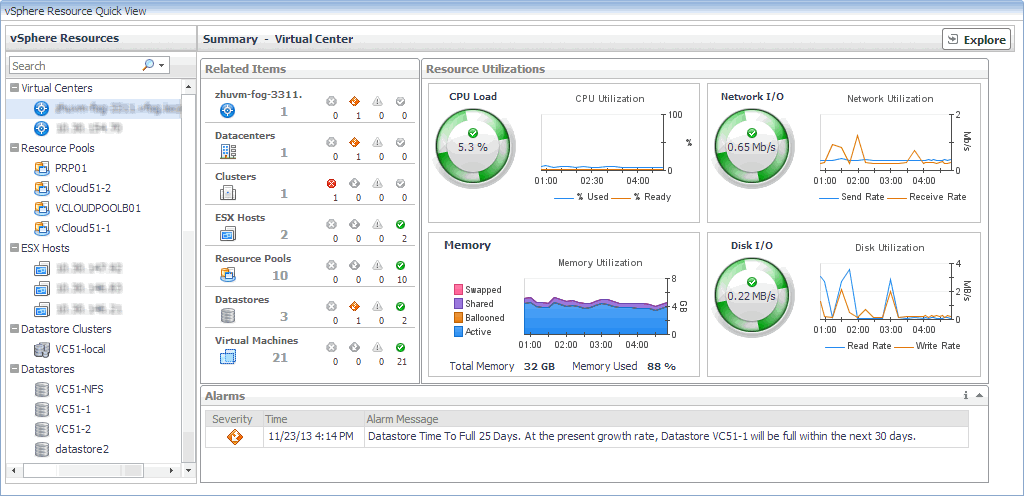
You can monitor the resource usage, allocation, and overhead of these elements when you select them in the Quick View. The information appearing in this view can help you discover potential resource-level issues such as spikes in CPU, memory and disk usage, and to reallocate resources, when required.

1
On the navigation panel, under Dashboards, click vCloud Director > vCloud Environment.
2
On the vCloud Environment dashboard, on the Monitoring tab, click the vSphere Resources tile.
The vSphere Resource Quick View appears, showing the performance summary for a component selected in the vSphere Resources pane on the left.
관련 문서

The document was helpful.

평가 결과 선택

I easily found the information I needed.

평가 결과 선택