Monitoring job progress
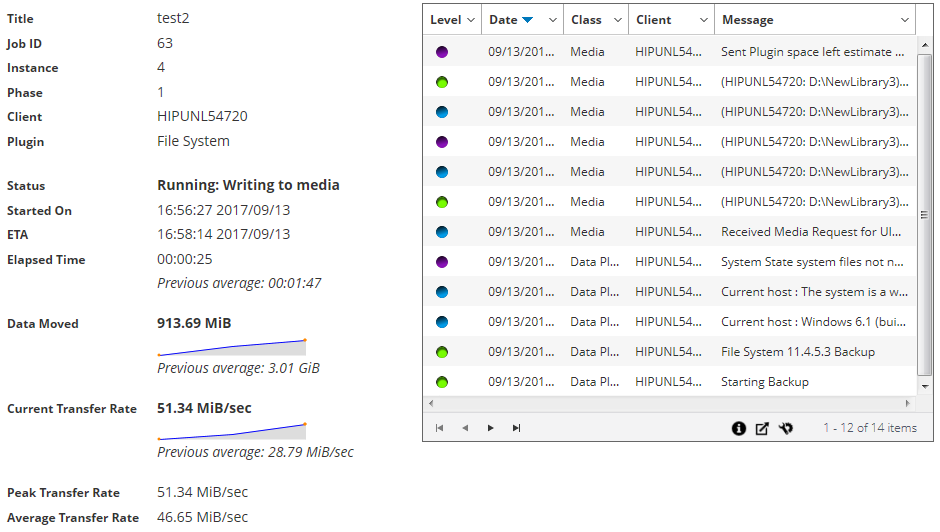
You can monitor the progress of a job from the Monitor Job page. The page displays the job status, data transfer rate, log messages, and other job details.
|
1 |
In the Navigation pane, click Job Status. |
|
3 |
On the Monitor Job page, you can view the following information: |
|
• |
Job details: This area displays the following details: job title, job ID, instance ID, phase number, client name, plug-in name, status, start time, expected completion time, time elapsed, size of data moved and data transfer chart, current transfer rate and data transfer chart, peak transfer rate, and average transfer rate. The fields: waiting for device, elapsed transfer, estimated transfer remaining, and estimated time remaining are also displayed when running a job using Plug-in for NDMP. The fields: waiting for device and elapsed transfer are also displayed when running a job using Plug-in for SnapMirror to Tape. However, the field ‘expected completion time’ is not displayed when running a job using Plug-in for NDMP and Plug-in for SnapMirror to Tape. |
|
• |
Job logs: This area displays the log messages generated for the job. By default, the table is sorted by date and time. You can sort the table by one or more columns, as required. For more information, see Sorting records in NetVault WebUI. |
Clearing job errors and warnings
|
1 |
In the Navigation pane, click Job Status. |
|
• |
|
• |
|
• |
Removing a job schedule
|
1 |
In the Navigation pane, click Job Status. |
|
2 |
In the list of jobs, select the job, and click Remove Schedule. |
Managing job definitions
MSP administrator, Tenant administrator, and Tenant users can manage their respective jobs.

