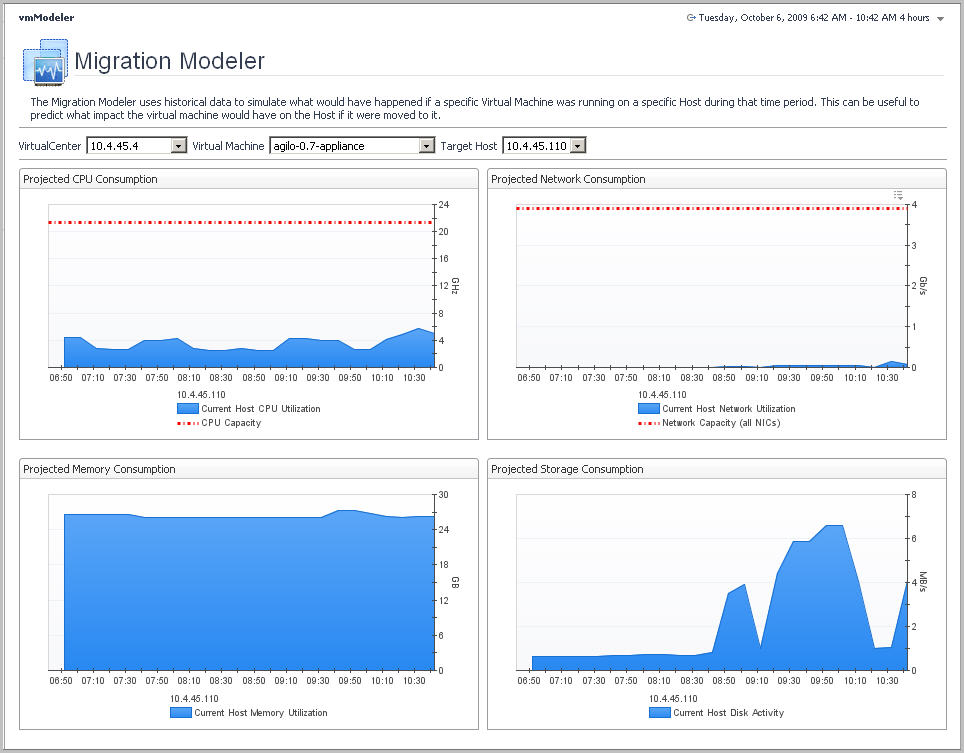
The blue area on the graphs represents current consumption or activity on the target ESX Host. The orange area specifies projected worst case consumption or activity. The red dotted line specifies the target ESX Host capacity with respect to the corresponding metric. For reference information about the data appearing on this dashboard, see VMware Modeler views .
When using the VMware Modeler dashboard, you should extend the time range in order to better assess the long term impact of the potential migration. For specific information about adjusting dashboard time ranges, refer to the Foglight for VMware User Guide.
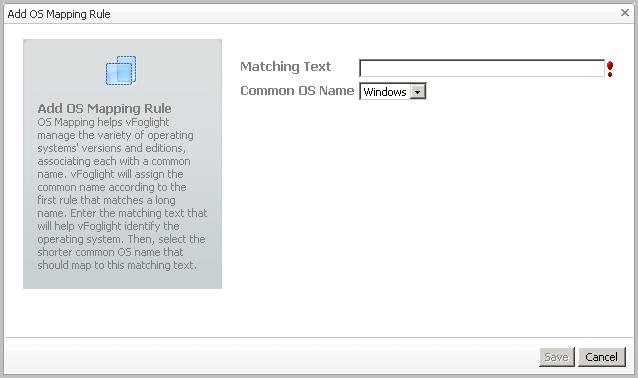
OS mapping involves associating various versions and editions of a particular operating system with a common OS name. You configure OS mapping rules using the Administration tab on the VMware Environment dashboard. This helps Foglight for VMware map the OS names reported by Foglight for VMware to those reported by physical OS monitoring, so that you can view all Windows machines, all Linux machines, and so on.
For reference information about this view, see OS Mapping view .
|
• |
|
1 |
|
2 |
In the Add OS Mapping Rule dialog box, in the Matching Text box, type the OS name with its edition and/or version number to help Foglight for VMware identify the operating system. |
|
3 |
In the Common OS Name list, select the shorter common OS name. |
|
4 |
Click Save. |
|
1 |
In the OS Mapping view, select an OS mapping rule by clicking the associated check box in the left column. |
|
2 |
Click Delete. |
|
3 |
Click Save. |
|
• |
In the OS Mapping view, move a rule one level up by clicking the up arrow in the rule’s row. |
Explore the Instances and Limits view to see the existing VMware object types. To access this view, on the VMware Environment dashboard, open the Administration tab, and click Review Instances and Limits.
The Instances and Limits view displays the list of the existing VMware object types, and for each type it shows the type name, instance limit, instance count, instance limit utilization, and the current status given as a highest severity level associated with an instance of that type. This information can give you insight into the size of your database and whether additional adjustments are required to improve your system performance. For example, if an object type results in a high number of object instances, this may result in performance bottlenecks. To prevent them, check if any of these are updated recently and, if not, delete them from the database.
To view the list of existing registry variables or to edit them, click Edit Registry Variable in the top-left corner. For complete information about registry variables, see the Administration and Configuration Help.
For reference information about this view, see Instances and Limits view .