|
2 |
Review overall performance in the Summary tab. |
|
• |
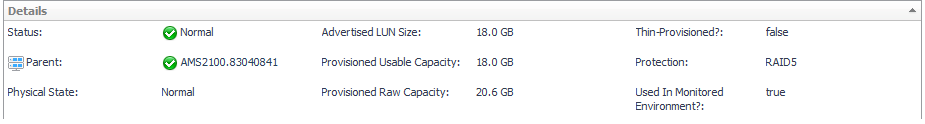
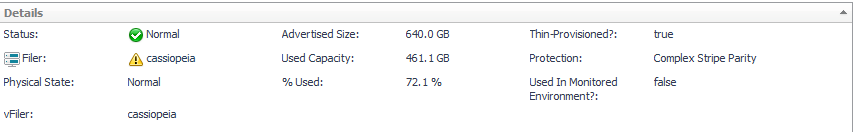
Details. Displays the LUN’s status, physical details, parent device and capacity metrics. |
|
• |
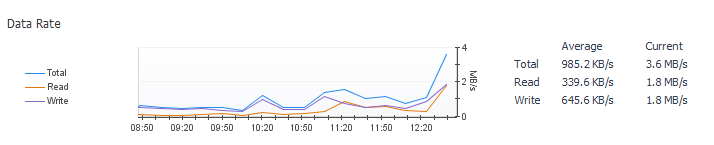
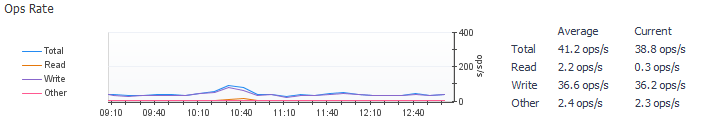
Charts. Plot values over the time period for these metrics, if available: Ops Rate, Data Rate, Latency, % Busy, Cache Hit Rate, and Average Queue Depth. |
|
• |
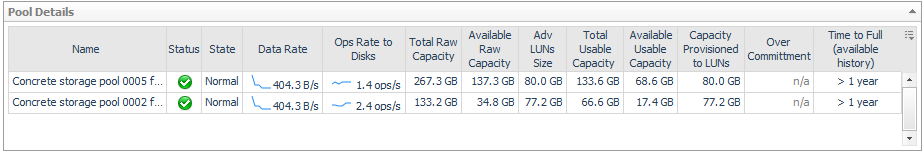
Pool Details. Identifies the pools to which the LUN belongs. |
|
• |
Alarm Summary. Displays alarms on the LUN. |
|
3 |
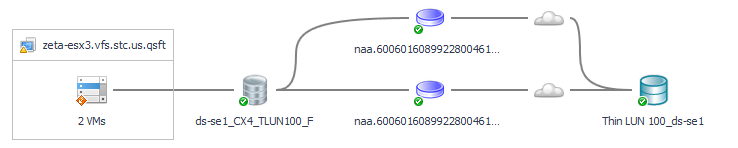
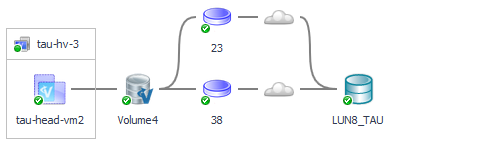
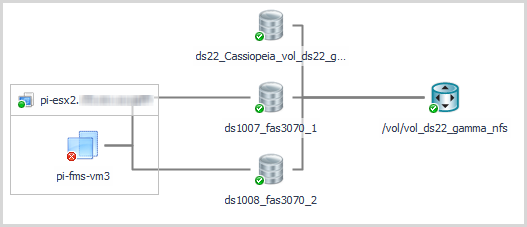
Click the Topology tab. |
|
• |
Click a |
|
4 |
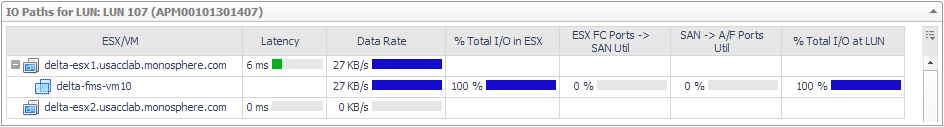
Click the SAN Data Paths tab. |
|
TIP: For metrics that have thresholds, the color of the bars highlight data values that fall within normal, warning, critical, and fatal thresholds.Thresholds are set in the registry variables StSAN.FCSwitchPortUtilization.[Warning|Critical|Fatal]. |
|
• |
ESX/VMs or Hyper-V Server/VM. List of servers and the VMs they host. |
|
• |
Latency. Average latency per operation in the time period. |
|
• |
Data Rate. Average data rate for I/O from the ESX or VM to the LUN over the time period. |
|
• |
% Total I/O in ESX or % Total I/O in Hyper-V Server. When multiple VMs on a server are performing I/O to the same LUN, displays the percentage of the total I/O performed by this VM. |
|
• |
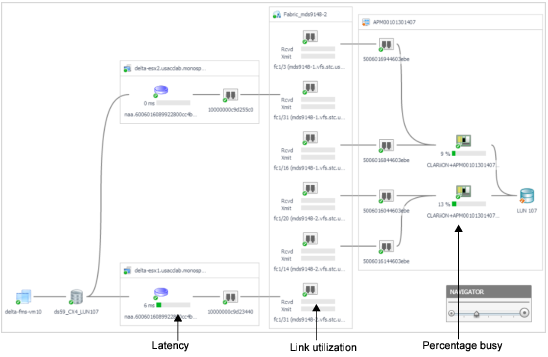
ESX FC Ports --> SAN Util or Hyper-V Server FC --> Ports SAN Util. Displays the busiest link (read or write utilization) over a time period. Click the cell to display all the port links. Review the topology diagram to see the ports and link utilization. Data is not available for IP ports. |
|
• |
SAN --> A/F Ports Util. Displays the busiest link (read or write utilization) over the time period. Click the cell to display all the port links. Review the topology diagram to see the ports and link utilization. Data is not available for IP ports. |
|
• |
% Total I/O at LUN. When VMs on multiple servers are doing I/O to the same LUN, displays the percentage of the total I/O performed by this server. |
|
• |
LUN Latency (ms). Displays the latency of LUN in ms. |
|
• |
Click a host, VM, or virtual storage name or icon. See the Managing Virtualized Environments User and Reference Guide. |
|
2 |
Review overall performance in the Summary tab. |
|
• |
Details. Displays the volume’s status, physical state, physical details, parent devices, and alarms on disks in the volume. Also displays current values for Advertised NASVolumes Size, Used Capacity, and % Used. |
|
• |
Charts. Displays the following metrics over the time period: |
|
• |
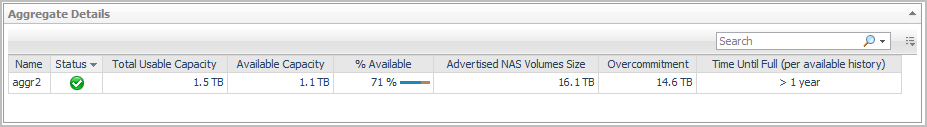
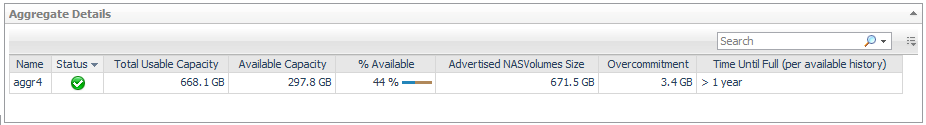
Aggregate Details. Displays values for Total Usable Capacity, Available Usable Capacity % Available, Advertised NASVolumes Size, and Overcommitment. |
|
• |
Alarm Summary. Displays alarms on the NASVolume. |
|
3 |
Click the Topology tab. |
|
4 |
Click the Disks tab. |
|
• |
Click a host, VM, or datastore name or icon. See the Managing Virtualized Environments User and Reference Guide. |
|
2 |
Review overall performance in the Summary tab. |
|
• |
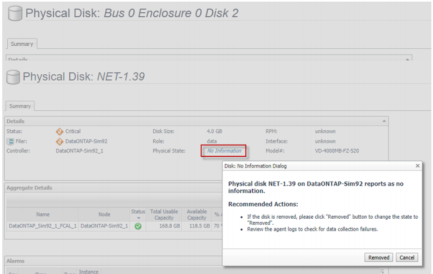
Disk Details. Displays the disk’s status, physical details, parent device, and size if available. |
|
• |
Physical State: Displays the physical state the of disk. It will be marked as "No Information" if the disk does not commit any performance data. To mark disks as "Removed", click on "No Information" link and confirm the disk is removed physically by pressing "Removed" button. |
|
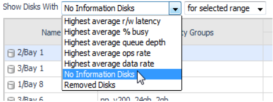
NOTE: Selecting "No Information Disks" metric from Show Disks With drop down shows the disks with no metrics provided by the Agent. Selecting "Removed Disks" metric from Show Disks With drop down shows the disks manually marked as "Removed" Physical State in No Information Dialog. |
|
• |
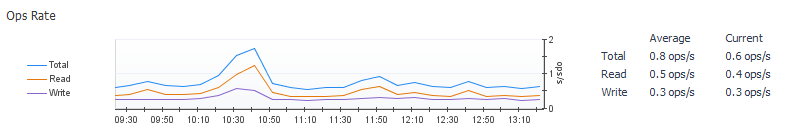
Charts. Displays the following metrics over the time period: |
|
• |
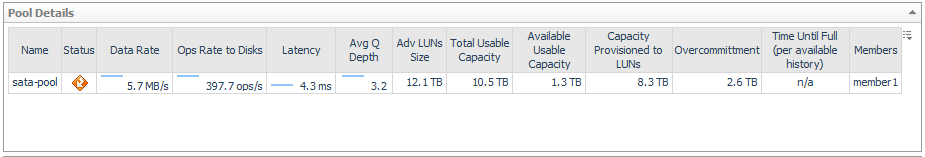
Pool Details (Arrays only). Displays performance and capacity metrics for the pools to which this disk contributes resources. For more information, see Performance Metrics and Capacity Metrics. To investigate a pool, click its name. For more information, see Investigating a Pool. |
Isilon storage arrays—Displays the same information as the Pool Details view on the Pools tab of the Isilon Storage Array dashboard, but the data reflects only the pools relevant to the selected disk. For more information, see EMC VPLEX Storage Array.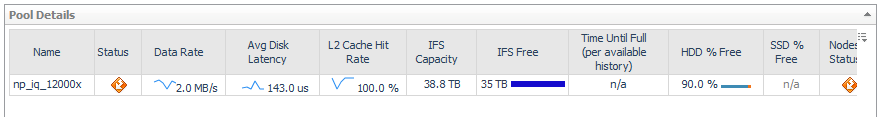
|
• |
Aggregate Details (Filers only). Lists the aggregates to which this disk contributes resources. For each aggregate, displays its name, status, physical state, and current values for Total Usable Capacity, Available Usable Capacity % Available, Advertised NASVolumes Size, and Overcommitment. To investigate an aggregate, click its name. See Investigating an Aggregate. |
|
• |
Alarm Summary. Displays alarms on the disk. |
