Replication Server Metrics
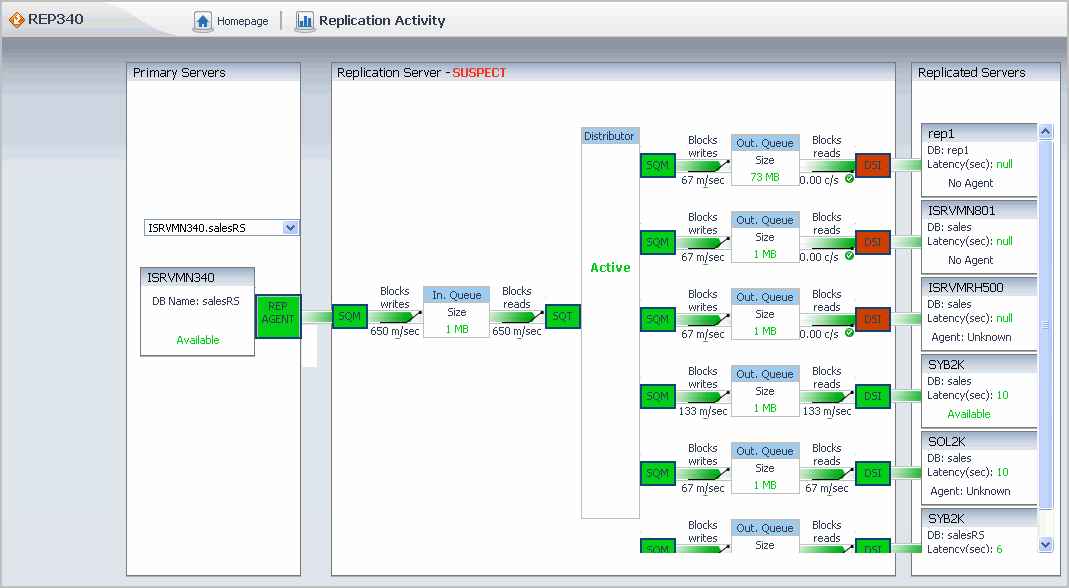
There are multiple sections in the Replication Server pane:
|
• |
Each of the Primary Server sections shows Primary Server - Replicated Server Status information for a primary server. |
|
• |
The bottom section shows Partitions information. |
The pane title line indicates the overall status of the replication server, which is either:
The top sections show sets of related primary and replicated server information:
Click the Pop Up Screen button to see the full list of replicated server databases.
Replication Server Activity Dashboard
To display this dashboard, on the Sybase MDA Global View Dashboard, drill down on a Sybase_RS agent, and on the RS Home Page Dashboard that appears, click Rep Server Activity.
The dashboard contains the following sections:
Drilldown dashboards may be accessed through some of the dashboard element metrics.
Primary Servers Metrics
|
Shows the database name and the status of the Sybase_MDA Agent. The status of the Sybase_MDA agent: You can drill down by clicking on this status field. The MDA Home Page Dashboard appears for the appropriate server. | |
Replication Server Metrics
The pane title line indicates the overall status of the replication server, which is either:
|
The status of the DSI thread that is associated with a replicated server. |

