지금 지원 담당자와 채팅
지원 담당자와 채팅

Foglight for Infrastructure 5.9.7 - Infrastructure Utilities User Guide

Monitoring Web transactions
Configuring credentials for Web sites requiring user or proxy authentication Exploring your collection of monitored Web sites Investigating the performance of Web transactions and monitoring locations Exploring Web Monitor services Generating reports Configuring Web Monitor agent properties View reference
Monitoring network devices

FAQts view

The FAQts view shows answers to common questions related to your transactions or locations. The collection of available questions depends on the tile selected in the Web Monitor Environment view. If you select the Transaction tile, this view displays the questions related to your transactions. If you select the Locations tile. the view displays the questions related to your locations.
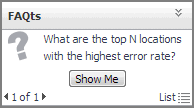
In the Performance Browser, in the Quick View, the FAQts view appears in the bottom-left corner.

Location drilldown view

The Location drilldown view provides details about a monitoring location. use this view to investigate the overall state of the transactions monitored from that location, the associated response metrics, response-time and data collection metrics, its overall health during the monitored time range, and the state of transactions monitored from this location.

2
In the Quick View, in the Locations view, select a location.
3
In the Location view, click Explore.
The Locations view appears in the display area.

This view is made up of the following embedded views:

Table 2. Alarms view

Shows the numbers of alarms generated against the selected monitoring location, broken down by alarm type (Normal, Warning, Critical, Fatal).

Table 3. Location view

Displays details about the selected location.

Avg-Connect Time. The average amount of time the agent used to establish connections to the monitored Web site.
Avg-Page Get Time. The average amount of time the agent needs to retrieve the data from the monitored Web site.
Avg-Response Time. The average amount of time the agent waits for a response from the monitored Web site.
Health History. A color-coded bar, representing the alarm state of the monitored location over the selected time range. The color of the bar changes depending on the alarm state. Red indicates a Fatal state, orange indicates Critical, yellow means Warning, and green is the Normal State.
Last Polling Time. The date and time of the most recent data collection.
Location. The name of the host on which the Web Monitor Agent is running.
Total Error. The total number of execution attempts that resulted in errors the Web Monitor Agent encountered during the selected time range.
Total Execution. The total number of execution attempts the Web Monitor Agent performed during the selected time range.
Total Success. The total number of successful executions the Web Monitor Agent performed during the selected time range.

Displays details about each transaction monitored by the Web Monitor Agent that is deployed to the selected location

Executions (Attempts). The number of execution attempts the Web Monitor Agent performed to monitor this Web site since it started collecting data.
Health History (Rolled Up). A color-coded bar, representing the alarm state of the monitored Web site over the selected time range. The color of the bar changes depending on the alarm state. Red indicates a Fatal state, orange indicates Critical, yellow means Warning, and green is the Normal State.
Health. The highest severity alarms generated against this Web site: Normal , Warning , Critical , or Fatal .
Last Polling Time. The most recent date and time the Web Monitor Agent made an attempt to collect data from this Web site.
Name. The transaction name, associated with the monitored URL.
Success (Completed). The number of successful executions the Web Monitor Agent performed to monitor this Web site since it started collecting data.

Drill down on:

Location view

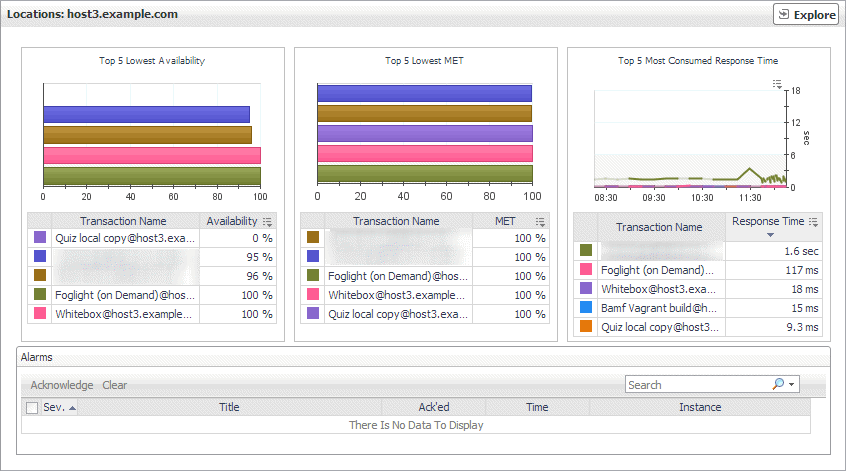
The Location view displays overall response and availability information for the transactions monitored from the selected location. It also identifies the transactions with the lowest availability, lowest MET (met expected time), and highest response time, showing the top five transactions in each of these categories. Use this view to identify the Web sites with degraded performance, and to perform further investigation.
2
In the Quick View, in the Locations view, select a location.
The Location view appears on the right.

This view is made up of the following embedded views:

Table 5. Alarms view

Lists the alarms generated against the selected location.

NOTE: To acknowledge or clear one or more alarms appearing in this table, select them and click Acknowledge or Clear, as required. For more information about alarms in Foglight, see the Foglight User Guide.
Ack’ed. Indicates if the alarm is acknowledged: true or false.
Instance. The name of the transaction against which the alarm is generated.
Severity. Indicates the alarm severity: Warning , Critical , or Fatal .
Time. The time at which the alarm is generated.
Title. The name of the rule that generated the alarm.

Drill down on:

Any row in this table. Displays the Alarm dialog box, showing additional information about the alarm. For more information about alarms in Foglight, see the Foglight User Help.

Shows the top five transactions with the lowest availability.

Availability. The percentage of times the Web site was available when the Web Monitor Agent attempted to collect information from it.
Transaction Name. The transaction name, associated with the monitored URL.

Drill down on:

Shows the top five transactions with the lowest MET.

MET. The percentage of times the Web site meets its acceptable time expected by the end user.
Transaction Name. The transaction name, associated with the monitored URL.

Drill down on:

Shows the top five transactions with the highest response time.

Response Time. The amount of time the Web site takes to respond to the Web Monitor Agent request.
Transaction Name. The transaction name, associated with the monitored URL.

Drill down on:

Locations view

The Locations view lists the hosts that are running instances of the Web Monitor Agent, and shows their states.
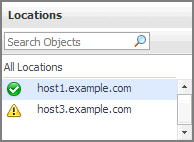
Selecting All Locations shows a list of all host names in the Summary - All Locations view on the right. Similarly, selecting a location in the list shows location-specific metrics in the Location view view on the right.

The Locations view appears in the Quick View on the left.
Alarm severity. The state of the most recent alarm raised against the associated location: Warning , Critical , or Fatal .
All Locations. A parent node for the location object instances that appear in this view.
Location. The name of the host on which the Web Monitor Agent is running.

Drill down on:

Location. Shows the Location view in the Quick View.
관련 문서

The document was helpful.

평가 결과 선택

I easily found the information I needed.

평가 결과 선택