Back Up and Restore Foglight
Backup and restore processes are important aspects of database administration. The term backing up refers to making copies of data that can be used to restore your system after a data loss event. The backup process includes:
Restoring a physical backup means reconstructing it and making it available to users. You can restore a previous Foglight installation from a backed up copy of the original environment.
For more information, see the following topics:
Configure Rules and Metric Calculations to Discover Bottlenecks
The Foglight® Management Server and individual cartridges each come with a set of topology types, data retention policies, rules, and calculations, that, in most cases, work out-of-the-box. In more complex environments, your business case may require additional tuning.
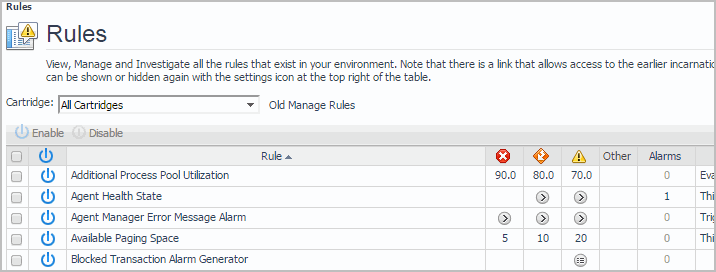
There are two types of rules in Foglight: simple rules and multiple-severity rules. Simple rules do not generate alarms, they fire and invoke actions when their conditions are met. Multiple-severity rules include up to five severity levels and generate alarms when the condition associated with any one of its severity levels is met.
Rules have four types of triggers: data-, time-, schedule-, and event-driven triggers.
|
• |
Event-driven triggers cause the rule conditions to be evaluated as a response to one of the following events: AgentManagementSystemEvent, AlarmSystemEvent, or ReportGeneratedEvent. |
Many rules come included with Foglight and installed cartridges, such as Agent Health State, BSM All Events, Catalyst Data Service Discarding Data, and others. If the existing rules do not meet your needs, you can create a new one and add it to the rule collection.
A typical installation can include a large number of rules. You can create and manage multiple-severity rules using the Rule Management dashboard. To access this dashboard, on the navigation panel, click Dashboards > Administration > Rules & Notifications > Rules. The Rules dashboard provides access to modifying threshold variables appearing in rule conditions. For an extended set of rule management tasks, such as viewing and editing rule definitions, copying, disabling, and enabling rules, suspending or resuming rule actions, use the Manage Rules dashboard. Click Old Manage Rules to access the Manage Rules dashboard.
To obtain additional diagnostics about rule behavior and how they affect your monitoring environment, use the Rule Diagnostics dashboard. From here, drill down to a specific rule and explore the objects are affected by the rule, or find out how many times a rule was executed against a specific object. This can help you understand rule behavior and debug any problems associated with a particular rule. To access this dashboard, from the navigation panel, click Dashboards > Administration > Rules & Notifications > Rules, then click Diagnostics from the rule’s context menu.
For more information, see the following topics:
Working with Derived Metrics
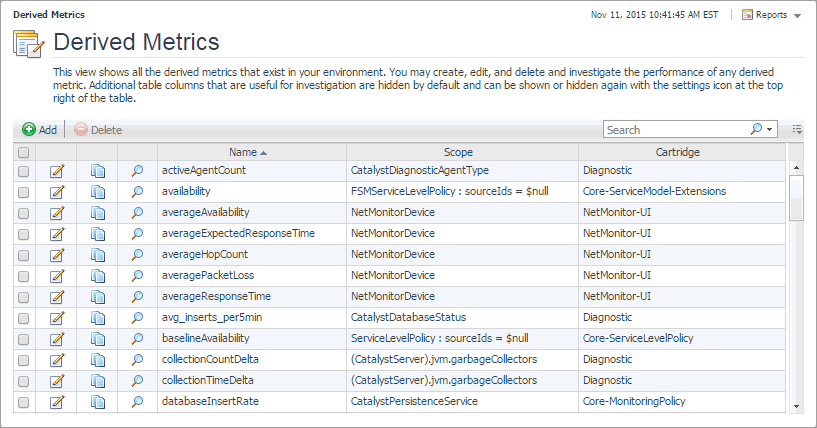
A metric is a specific value that is measured over time. There are two types of metrics in Foglight: raw metrics and derived metrics. Raw metrics are collected directly from your monitored environment and sent to the Foglight Management Server. Derived metrics are calculated from one or more raw or derived metrics. They are scoped to a topology type and can optionally be scoped to specific objects of that type. Many derived metrics come included with Foglight and installed cartridges. If none of the existing derived metrics meet your needs, you can create a new one and add it to the derived metric collection.
You can create and manage derived metrics using the Manage Derived Metrics dashboard. A typical installation can include a large number of rules. The Manage Derived Metrics dashboard lists all derived metrics that exist in your environment, and allows you to drill down to derived metric definitions. To access this dashboard, from the navigation panel, click Dashboards > Administration > Data > Derived Metrics.
For more information, see the following topics:
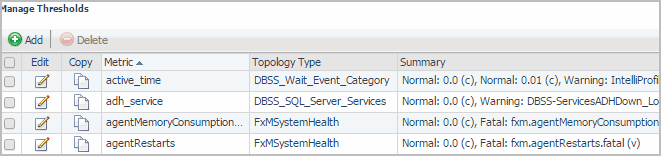
Working with Metric Thresholds
Threshold levels in metrics are useful in situations when you need to reference a specific metric value multiple times, for example in derived metrics or rules. Each metric can have one threshold associated with it. A threshold is always associated with a threshold level. Threshold levels refer to a particular state of monitoring entities, such as agent states, alarm severities, and others. Each threshold level includes a unique set of threshold bound levels that are specific to that level. For example, the threshold level AgentState comes with several bound levels that relate to agent states, such as Running and Collecting Data.
You can create and manage thresholds using the Manage Thresholds dashboard. To access this dashboard, from the navigation panel, click Dashboards > Administration > Data > Manage Thresholds.