지금 지원 담당자와 채팅
지원 담당자와 채팅

Foglight for SNMP 5.9.5 - User and Reference Guide

Overview tab

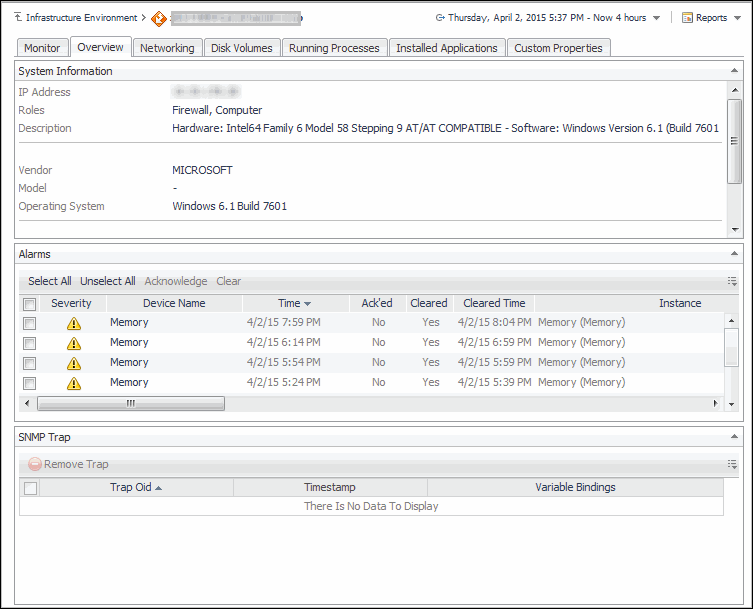
This tab displays only when a host is monitored by an SNMP agent. If a host is not monitored by an SNMP agent, then the Overview tab does not display.

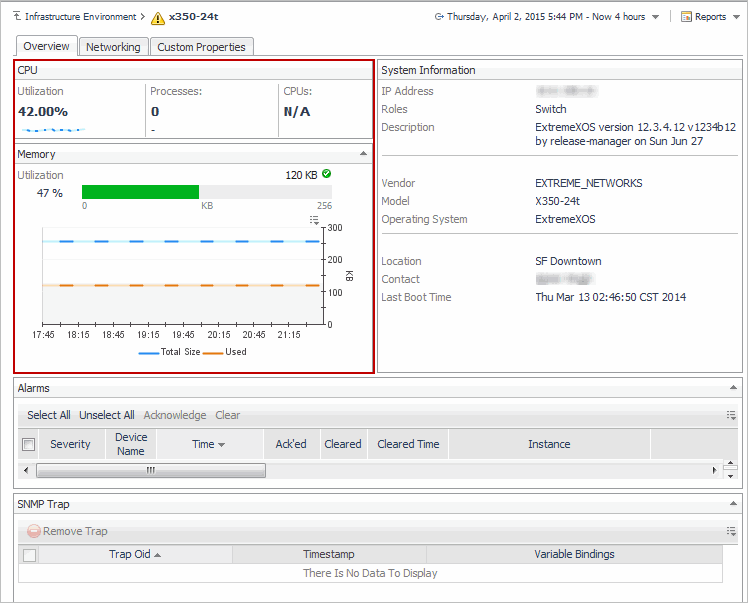
If a host is monitored by an Infrastructure agent, the Overview tab displays system information, alarms, and SNMP traps. If a host is not monitored by an infrastructure agent, CPU and memory information also displays.

This view is made up of the following embedded views:

Table 2. Alarms view

This view shows the number of alarms associated with the monitored device.

Table 3. CPU view

Monitors the number of processors, current usage, and average usage over time from a device.

Data Displayed

Displays the total amount of memory usage for the host.

Table 4. Memory view

Displays the current memory utilization percentage and the utilization percentage over time.

The notification messages received from SNMP-managed devices.

Provides device IP address, device type and roles, operating system, and other detailed system information for a device.

Networking tab

This tab displays only when a host is monitored by an SNMP agent. If a host is not monitored by an SNMP agent, then the Networking tab does not display.

Through two embedded views (All Network Interface (xx) and Network Statistics Summary), the Networking view enables you to view information pertaining to monitored network interfaces.

Figure 12. Networking view

This view is made up of the following embedded views:

Pre-defined Foglight for SNMP network monitors

The networking tab is populated by four different pre-defined Foglight for SNMP network monitors.

For information on configuring network monitors, see Configuring SNMP agent properties .

The All Network Interface (xx) view displays a table listing all monitored network interfaces associated with the selected device. Selecting a particular network interface refreshes the view below the table to display detailed information about that network interface.

The view title displays in a numeric format within brackets the number of monitored network interfaces.

The network data related to the monitored device.

The detailed view of the selected network interface is made up of the following embedded views

This view displays information about network transmission pertaining to received and sent packets, including errors, discards, unicast, broadcast and multicast packets. With this information, you can easily analyze the network interface's network data transmission.

When a failure occurs during data transmission on an Ethernet network, it is always difficult to determine whether it is a link failure or a port fault. The information displayed on this view helps you analyze Ethernet problems.

This view displays a summary of network statistics.

General

ICMP

TCP

UDP

Disk Volumes tab

This tab displays disk usage and total capacity per volume for a device. Results are available in raw numbers and as percentages.

The Disk Volumes tab displays when a host is monitored by an SNMP agent only. If a host is monitored by an Infrastructure agent then the Disk Volumes tab does not display.

The table is comprised of the following fields:

관련 문서

The document was helpful.

평가 결과 선택

I easily found the information I needed.

평가 결과 선택