Monitoring Storage Arrays
|
1 |
On the Storage Environment dashboard, ensure the Monitoring tab is selected. |
|
2 |
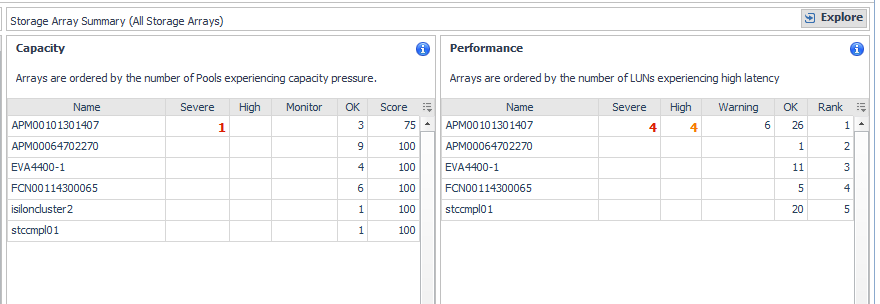
Click the Storage Arrays tile to open the Storage Arrays quick view. |
|
3 |
|
• |
|
• |
|
• |
|
• |
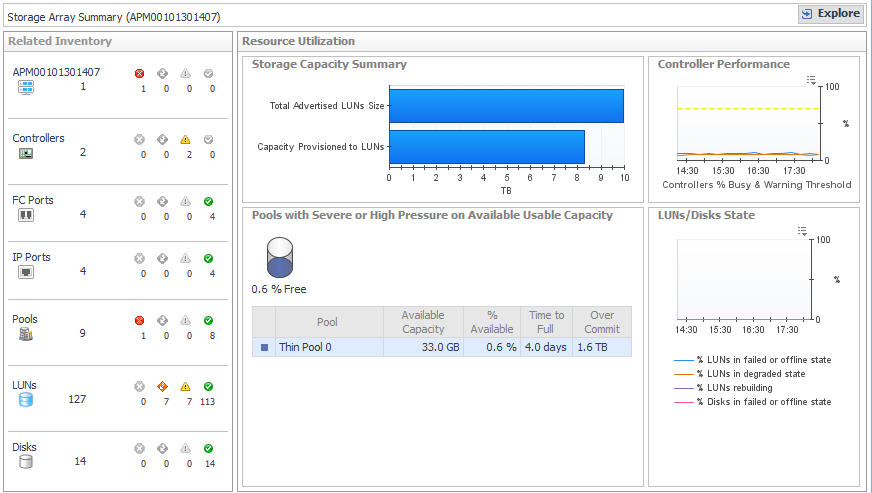
Related Inventory. Contains alarm summaries for the selected storage array and its controllers, FC ports, IP ports, pools, LUNs, and disks. |
|
• |
Storage Capacity Summary. Displays current values for Total Advertised LUNs Size and Capacity Provisioned to LUNs. |
|
• |
Controller Performance. Plots % Busy values by controller over the time period and displays threshold lines (defined in registry variable StSAN.Controller.PctBusyThreshold). |
|
• |
Pools with Severe or High Pressure on Available Usable Capacity (or Raw Capacity) |
|
• |
LUNs/Disks States. Plots the percentage of disks and LUNs in the storage array in problem states. Problem states are reported by the vendor. Resolving these issues may improve LUN performance. |
|
• |
|
• |
To return to this quick view, in the breadcrumbs, click Storage Environment. |
Monitoring Filers
|
1 |
On the Storage Environment dashboard, ensure the Monitoring tab is selected. |
|
2 |
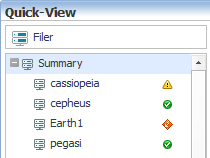
Click the Filers tile to open the Filers quick view. |
|
• |
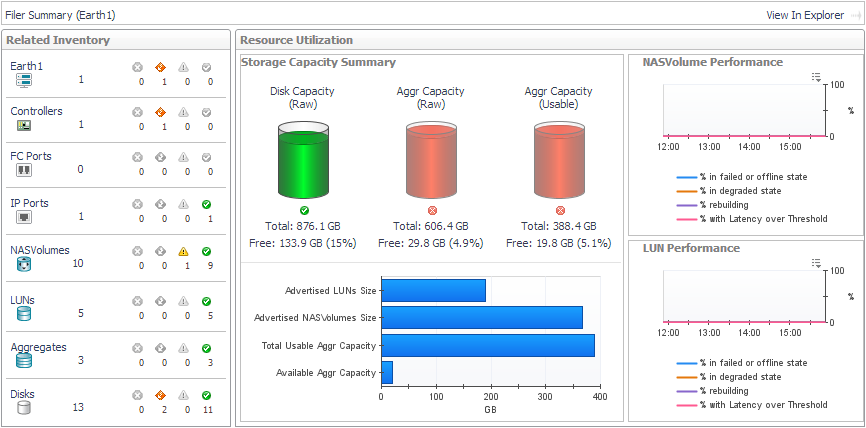
Filers with Lowest % of Free Disk/Spares Capacity (raw). Displays cylinders showing the amount of used Free Disk/Spares Capacity (Raw). Below each cylinder, you can see total and free capacity. |
|
• |
Filers with Lowest % of Available Aggr Capacity (usable). Displays cylinders showing the amount of used Aggr Capacity (Usable) Free. Below each cylinder, you can see total and free capacity. |
|
• |
|
• |
Aggregate capacity: StSAN.FilerAggregates.PctUnallocatedCapacityThreshold.[Fatal|Critical|Warning] |
|
• |
Storage Capacity Summary. The cylinders show the amount of capacity consumed in the filer, expressed using current values for the following pairs of metrics: |
- Aggr Capacity (Raw) Total and Aggr Capacity (Raw) Free
- Aggr Capacity (Usable) Total and Aggr Capacity (Usable) Free
|
• |
NASVolume Performance. Plots the percentage of NASVolumes in the filer in problem states. Problem states are reported by the vendor. Resolving issues may improve volume performance. |
|
• |
LUN Performance. Plots the percentage of LUNs in the filer in problem states. Problem states are reported by the vendor. Resolving issues may improve LUN performance. |
|
• |
To explore details about the filer and its child components, click View in Explorer. See Exploring a Filer. |
|
• |
To return to this quick view, in the breadcrumbs, click Storage Environment. |
Asking Questions About the Monitored Storage Environment
Another way to find out information about your storage environment is to ask questions. The Insights tab contains the Analytics view to show frequently-asked questions about storage environments. Answers are displayed in the form of tables and graphs. You can select questions that apply to all storage resources or to a specific type of storage resource.
|
1 |


