
Preface
SharePlex Manager Overview
Replication Streams and Configuration
Replication Stream Overview
Running the Discovery Wizard
Setting Up a New Replication Stream
Managing SharePlex Configuration Files
Setting Parameters
Manage Monitoring
Alert and Alarm Rules
Appendix: SharePlex Manager Dashboard
Replication Overview
Instance Overview
Instance Detail
Viewing, Clearing and Ignoring Events
Viewing Events
Clearing Events
Ignoring Events
Appendix: Starting SharePlex Web Services
Manage Monitoring
To open the Manage Monitoring console, do one of the following:
|
• |
Click Manage Monitoring at the conclusion of the discovery process. |
|
• |
You must have at least one replication view already defined to open the Manage Monitoring console. If not, SharePlex Manager opens the Discovery Wizard when you click Manage Monitoring. For more information, see the section, “Running the Discovery Wizard” on page 11.
|
Note |
Access to the Manage Monitoring console is controlled by security rights. If you do not have proper security rights, the Manage Monitoring option is deactivated. |
|
1 |
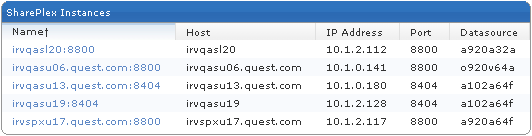
In the Manage Monitoring console, click Instances. |
|
3 |
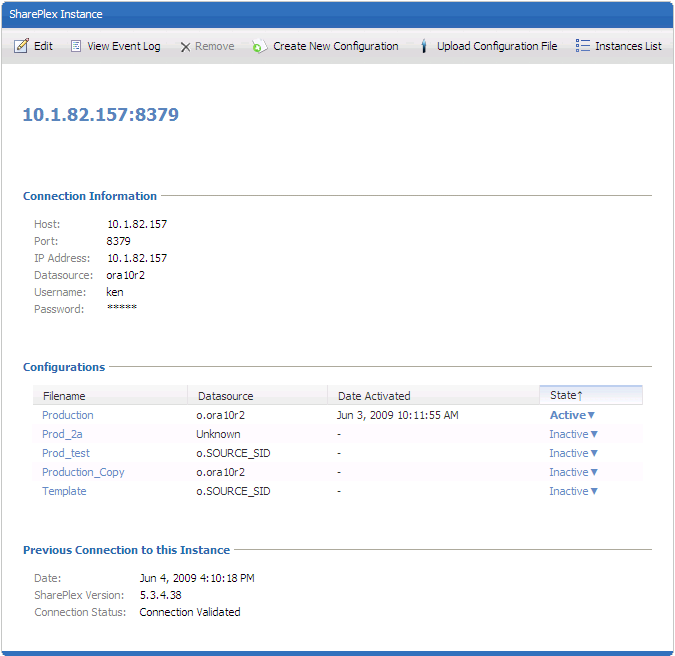
Click Edit. |
|
5 |
Click Save. |
|
Note |
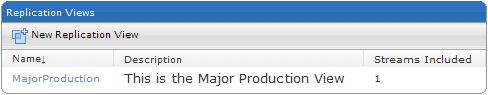
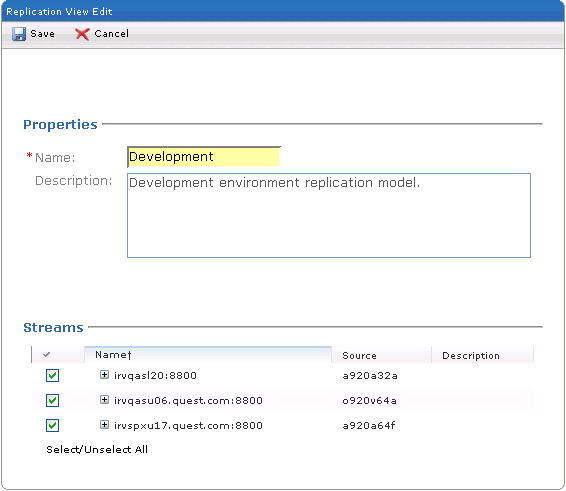
If you want to create a new replication view, click New Replication View. Then specify a name for view, add a description (optional), and lastly select the replication streams you want to add to the view. |
|
5 |
Click Save. |
|
1 |

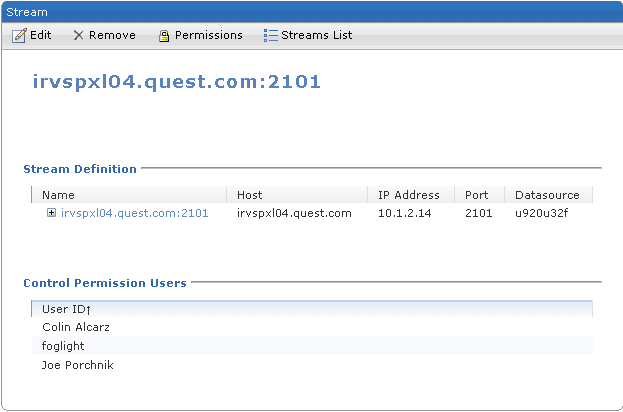
|
Note |
If you have the security rights to set control permissions, you can click Permissions and specify which users have the right to execute control commands on replication processes for the selected stream. For more information on setting control permissions, see the section, “Setting Control Permissions” on page 34. |
|
3 |
(Optional) Click Remove to delete the replication stream from any replication views. Then when prompted to confirm the removal, click OK. |
|
4 |
Click Edit. |

|
7 |
Click Save. |
SharePlex Manager Permissions can also be set for individual streams in the Stream window. For more information, see the section, “Managing SharePlex Configuration Files” on page 20.
|
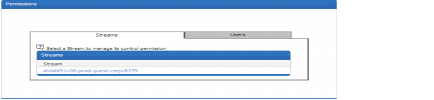
1 |
In the Manage Monitoring console, click Permissions. |
|
d |
Click Save. |
Alert and Alarm Rules
Global SharePlex Manager Rules
Most of the pre-defined rules for SharePlex Manager are disabled by default. A rule must be enabled before you can use it. For more information, see the section, “Enabling SharePlex Manager Rules” on page 43.
|
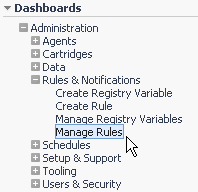
2 |
Open the Dashboards menu and select Administration>Rules & Notifications>Manage Rules. |
SharePlex Manager also includes four miscellaneous rules. These include:
Pre-defined Time Remaining Alerts and Alarms include the following:
|
1 |
|
4 |
Click on the icon ( |
|
5 |
Click OK in the confirmation dialog. |
After enabling a global SharePlex Manager rule, you can make a copy of it and then use that copy as the basis for a new rule that is applied to specific SharePlex objects. See the section “Specific SharePlex Manager Rules” on page 45 for more information.
Specific SharePlex Manager Rules
|
1 |
|
2 |
|
5 |
Click the Topology Type field and in the drop-down list select the SharePlex topology type you the rule is based on, i.e., SharePlex Capture Process. |
|
8 |
Click Insert Query. |
|
11 |
(Optional) Click the Fatal severity level to edit the alarm portion of the rule. |
This opens the Condition tab for the severity. The conditions for each global SharePlex Manager rule have been pre-defined in the Condition field with default trigger event values.
|
12 |
Make the changes you want in the Condition field. |
|
13 |
(Optional) In the Conditions & Actions tab, click the Warning severity level and edit the alert portion of the rule the same way you did the alarm portion. |
|
14 |
Click Save. |